Organizations across the world now focus on sustainability, carbon reduction, and clean energy adoption. Governments, investors, and customers expect businesses to measure and report their environmental performance clearly. However, many teams still struggle because they track green energy metrics using scattered spreadsheets and manual calculations. As a result, decision-making becomes slow and inaccurate.
A Green Energy Adoption KPI Dashboard in Google Sheets solves this challenge. It provides a structured, ready-to-use system that tracks renewable energy usage, emissions reduction, energy efficiency, and sustainability targets in one centralized dashboard. Because the dashboard works in Google Sheets, teams can collaborate easily, update data quickly, and view performance in real time.
In this article, we will explain how the dashboard works, what KPIs it includes, how each worksheet functions, and how organizations can use it to drive sustainability goals effectively.
What Is a Green Energy Adoption KPI Dashboard in Google Sheets?
Click to Buy Green Energy Adoption KPI Dashboard in Google Sheets
A Green Energy Adoption KPI Dashboard is a performance-tracking system that measures how effectively an organization adopts renewable energy sources and reduces environmental impact. It converts raw energy and sustainability data into meaningful KPIs, trends, and comparisons.
This dashboard helps organizations:
-
Track renewable energy usage
-
Measure carbon emission reduction
-
Monitor energy efficiency improvements
-
Compare actual performance against targets
-
Analyze monthly and yearly sustainability trends
Because the dashboard runs in Google Sheets, it remains flexible, cloud-based, and easy to maintain without expensive sustainability software.
Key Features of the Green Energy Adoption KPI Dashboard
This ready-to-use dashboard includes:
-
Month-wise KPI monitoring
-
MTD and YTD analysis
-
Target vs Actual comparison
-
Previous year benchmarking
-
Trend analysis for each KPI
-
Clear KPI definitions and formulas
All these features work together to provide complete visibility into green energy performance.
Dashboard Structure – Worksheet Overview
Click to Buy Green Energy Adoption KPI Dashboard in Google Sheets
The dashboard includes 6 structured worksheets, each designed for a specific purpose.
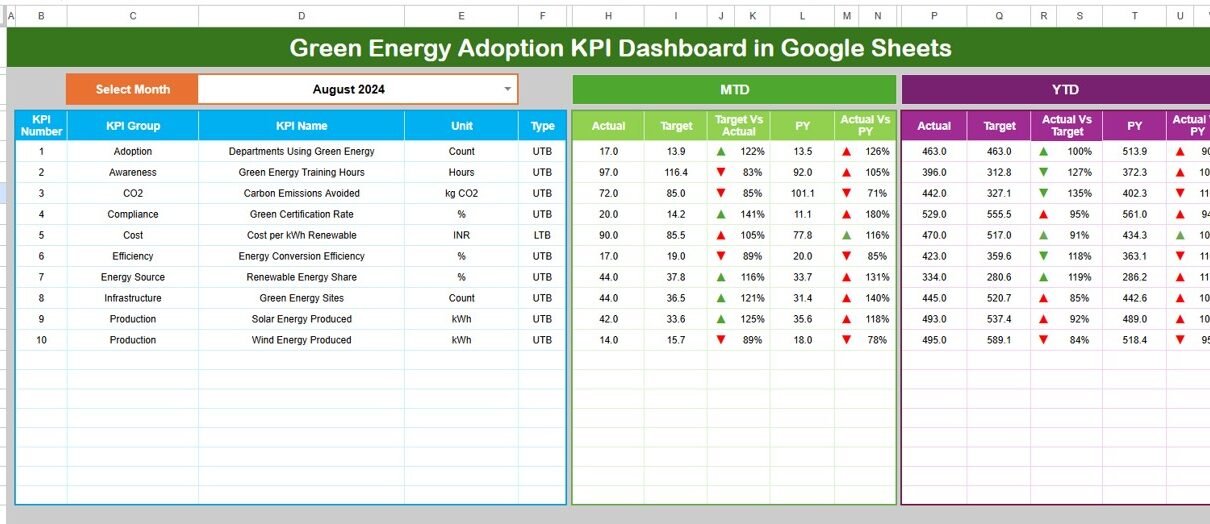
Dashboard Sheet Tab (Main Page)
This is the primary view of the entire dashboard.
-
You select the month from cell D3
-
All KPI values update automatically
The dashboard displays:
MTD Metrics
-
MTD Actual
-
MTD Target
-
MTD Previous Year
-
Target vs Actual
-
Previous Year vs Actual
YTD Metrics
-
YTD Actual
-
YTD Target
-
YTD Previous Year
-
Target vs Actual
-
Previous Year vs Actual
Conditional formatting with up and down arrows highlights performance:
-
Green arrow → improvement
-
Red arrow → decline

Click to Buy Green Energy Adoption KPI Dashboard in Google Sheets
KPI Trend Sheet Tab
This sheet allows detailed analysis of a single KPI.
-
Select the KPI from the dropdown in cell C3
The sheet displays:
- KPI Group
- KPI Unit
- KPI Type (Lower the Better / Upper the Better)
- KPI Formula
- KPI Definition
Trend charts show how the KPI performs across months. This helps identify seasonal patterns and improvement areas.

Click to Buy Green Energy Adoption KPI Dashboard in Google Sheets
Actual Number Sheet Tab
This sheet stores actual performance data.
-
Enter the first month of the year in cell E1
-
Fill MTD and YTD actual values for each KPI
Once updated, the dashboard recalculates automatically.

Target Sheet Tab
This sheet stores sustainability targets.
-
Monthly (MTD) targets
-
Yearly (YTD) targets
Targets help measure progress against sustainability commitments and ESG goals.

Click to Buy Green Energy Adoption KPI Dashboard in Google Sheets
Previous Year Number Sheet Tab
This sheet stores last year’s data.
It enables:
-
Year-over-year comparison
-
Long-term trend analysis
-
Measurement of improvement pace

KPI Definition Sheet Tab
This is the reference sheet for the entire dashboard.
It contains:
-
KPI Name
-
KPI Group
-
Unit
-
Formula
-
Definition
-
KPI Type (LTB / UTB)
This ensures consistency and clarity across teams.

Click to Buy Green Energy Adoption KPI Dashboard in Google Sheets
Why Do Organizations Need a Green Energy KPI Dashboard?
Organizations adopt green energy to reduce risk, improve brand reputation, and meet regulatory requirements. However, without proper tracking, sustainability goals remain theoretical.
This dashboard helps organizations:
-
Track ESG performance clearly
-
Measure progress toward net-zero goals
-
Identify inefficiencies early
-
Improve reporting transparency
-
Support sustainability audits
Advantages of Green Energy Adoption KPI Dashboard
1. Clear Sustainability Visibility
Leaders instantly understand renewable energy progress.
2. Better Decision-Making
Data-driven insights replace assumptions.
3. Improved ESG Reporting
Accurate KPIs support compliance and reporting.
4. Cost Optimization
Energy cost savings become visible and measurable.
5. Easy Collaboration
Google Sheets enables multi-user access.
Opportunities for Improvement in Green Energy Tracking
Click to Buy Green Energy Adoption KPI Dashboard in Google Sheets
Organizations can enhance the dashboard by adding:
-
Scope-1, Scope-2, and Scope-3 emission tracking
-
IoT or smart meter integrations
-
Predictive energy forecasting
-
Department-level energy KPIs
-
Automated sustainability alerts
These improvements strengthen long-term sustainability strategies.
Best Practices for Using the Dashboard
-
Update energy data monthly
-
Set realistic but challenging targets
-
Review trends, not only monthly values
-
Train teams on KPI definitions
-
Align KPIs with ESG and CSR goals
-
Protect data access with permissions
Conclusion
Click to Buy Green Energy Adoption KPI Dashboard in Google Sheets
A Green Energy Adoption KPI Dashboard in Google Sheets provides organizations with a practical and powerful way to track sustainability performance. It combines clear KPIs, automated calculations, and visual insights to support green energy adoption goals. Because it is simple, flexible, and cost-effective, the dashboard suits organizations of all sizes. With consistent usage and clear targets, this dashboard becomes a key driver of long-term environmental success.
Frequently Asked Questions (FAQs)
1. Who should use this dashboard?
Sustainability teams, energy managers, ESG teams, and leadership.
2. Can I customize KPIs?
Yes, you can easily add or modify KPIs.
3. Does it support ESG reporting?
Yes, it aligns well with ESG metrics.
4. Can I track multiple locations?
Yes, you can add location-wise data.
5. Is Google Sheets secure?
Yes, when access controls are applied correctly.
Visit our YouTube channel to learn step-by-step video tutorials
Youtube.com/@NeotechNavigators
Watch the step-by-step video tutorial:
Click to Buy Green Energy Adoption KPI Dashboard in Google Sheets