In this article, we will explore the Hospital Operations KPI Dashboard in Google Sheets, a ready-to-use template designed to help you monitor and optimize the key performance indicators (KPIs) that drive hospital operations. This dashboard allows healthcare managers and administrators to track metrics such as patient throughput, bed occupancy, and staff efficiency, making it easier to manage hospital performance and improve patient care.
Key Features of the Hospital Operations KPI Dashboard in Google Sheets
Click to buy Hospital Operations KPI Dashboard in Google Sheets
This dashboard includes 6 essential worksheets to track and analyze your hospital’s operations:
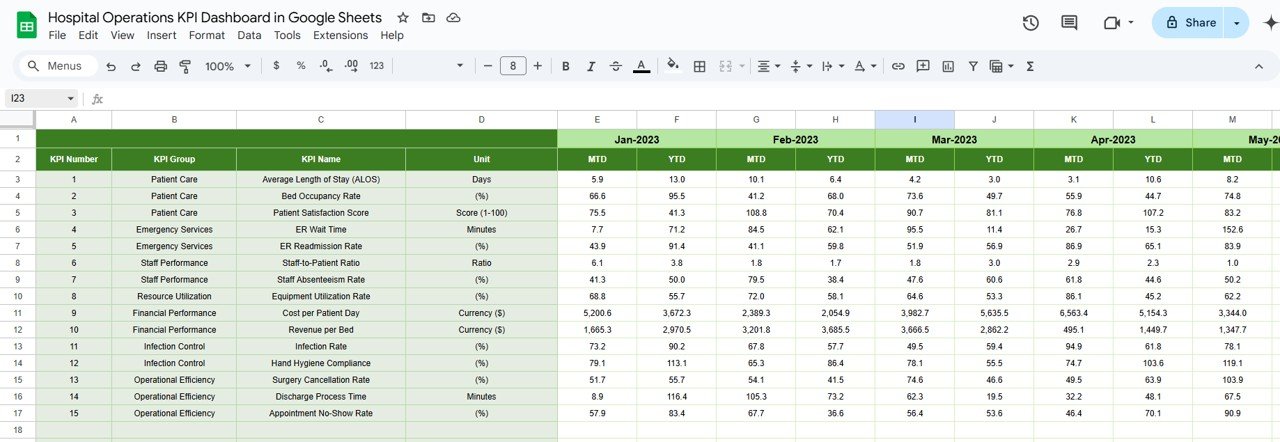
Dashboard Sheet Tab
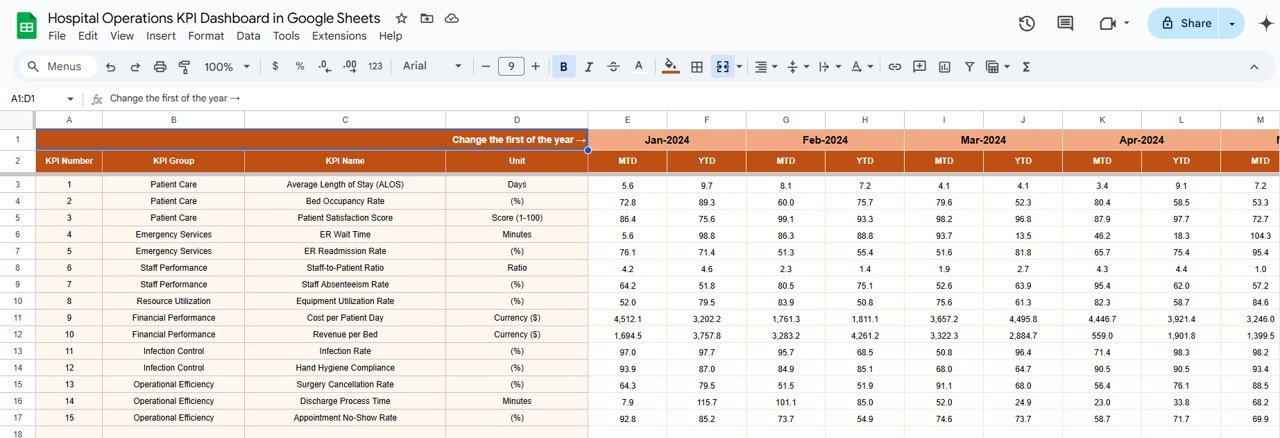
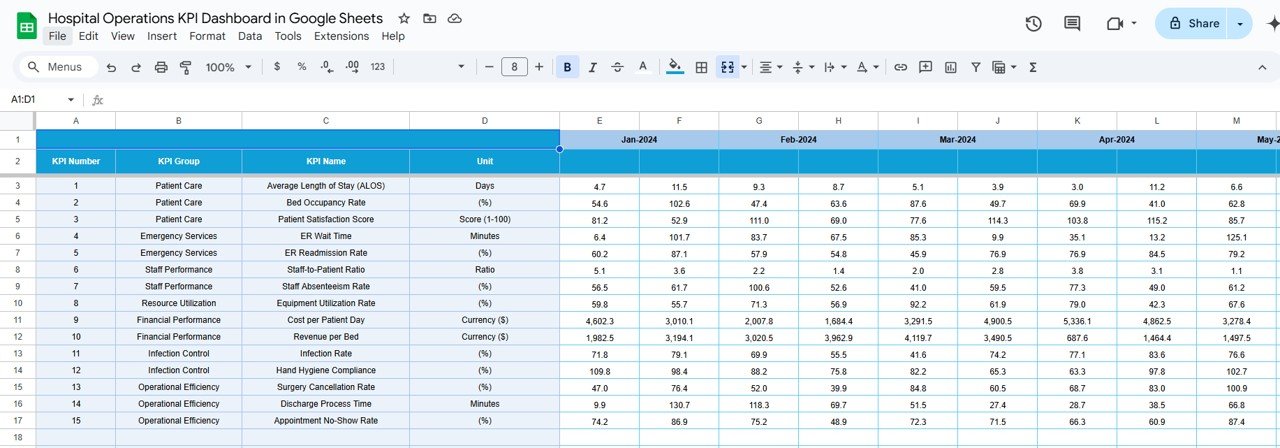
The Dashboard Sheet serves as the main overview, where you can track all KPIs in one place. By selecting the month from Range D3, the dashboard will update to reflect the data for that specific month.
The dashboard displays MTD (Month-to-Date) and YTD (Year-to-Date) metrics, including comparisons with Actuals, Targets, and Previous Year data. Conditional formatting (up/down arrows) is used to highlight performance differences.

Click to buy Hospital Operations KPI Dashboard in Google Sheets
KPI Trend Sheet Tab
This sheet allows you to select a specific KPI from a dropdown in Range C3.
You can view the KPI Group, Unit of KPI, KPI Type (whether it is Lower the Better (LTB) or Upper the Better (UTB)), and the Formula and Definition for each KPI.

Actual Numbers Sheet Tab
This sheet is used to input the actual numbers for MTD and YTD data. Simply change the month in Range E1 by entering the first month of the year.
Click to buy Hospital Operations KPI Dashboard in Google Sheets
Target Sheet Tab
Here, you enter the target values for each KPI, both for MTD and YTD, to compare actual performance against goals.
Previous Year Numbers Sheet Tab
In this tab, you can input the Previous Year’s data to facilitate year-over-year comparisons for each KPI.
Click to buy Hospital Operations KPI Dashboard in Google Sheets
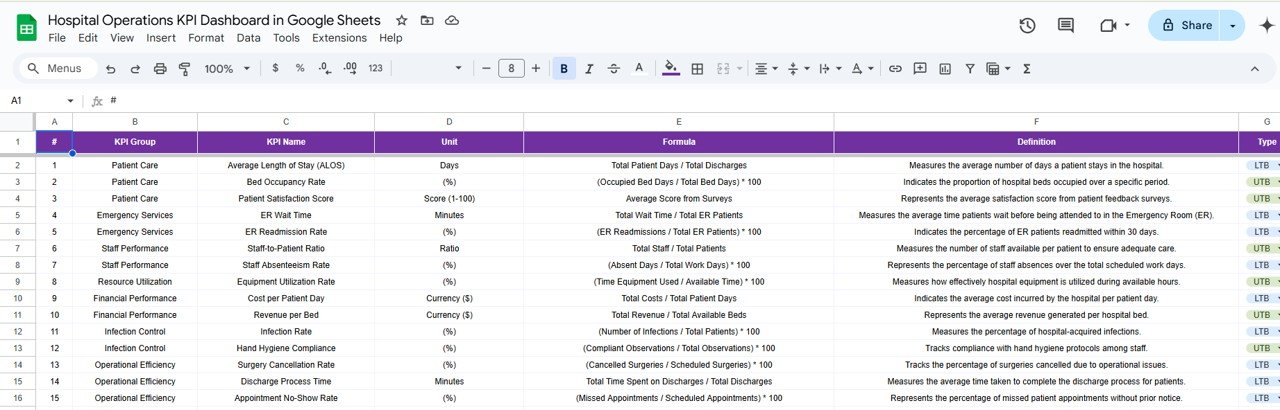
KPI Definition Sheet Tab
This sheet provides the KPI Name, KPI Group, Unit, Formula, and Definition for each KPI, serving as a reference for understanding the KPIs being tracked.
Benefits of Using the Hospital Operations KPI Dashboard
Click to buy Hospital Operations KPI Dashboard in Google Sheets
The Hospital Operations KPI Dashboard offers several advantages to healthcare managers and administrators:
-
Real-Time Monitoring: Track key performance indicators in real time, ensuring you can identify and address issues quickly.
-
Improved Decision Making: Use accurate data to make informed decisions about resource allocation, staffing, and patient care.
-
Enhanced Operational Efficiency: By tracking essential metrics like bed occupancy and patient wait times, you can identify inefficiencies and improve hospital processes.
-
Comprehensive Overview: The dashboard provides a comprehensive view of hospital performance, allowing you to track various aspects of operations in one place.
-
Year-Over-Year Analysis: Compare current data with previous year data to track improvements and identify areas needing attention.
Opportunities for Improvement in the Hospital Operations KPI Dashboard
To further enhance the effectiveness of the Hospital Operations KPI Dashboard, consider the following improvements:
-
Integration with Electronic Health Records (EHR): Integrating the dashboard with your hospital’s EHR system can automate data collection, providing more accurate and up-to-date information.
-
Advanced Data Visualization: Use more advanced charts, such as heatmaps or 3D graphs, to make the data more visually appealing and easier to interpret.
-
Mobile Optimization: Make the dashboard mobile-friendly so hospital administrators can monitor operations from anywhere, whether they are on the hospital floor or working remotely.
-
Patient Feedback Integration: Include patient feedback directly in the dashboard to better understand patient experiences and satisfaction.
Conclusion
The Hospital Operations KPI Dashboard in Google Sheets is a powerful tool for tracking and optimizing key performance indicators in hospital management. With real-time data on metrics like bed occupancy, patient wait time, and staff efficiency, hospital administrators can make informed decisions to improve operations and patient care. By using this dashboard, hospitals can enhance operational efficiency, reduce costs, and ultimately provide better care for their patients.
Click to buy Hospital Operations KPI Dashboard in Google Sheets
Visit our YouTube channel to learn step-by-step video tutorials
Youtube.com/@NeotechNavigators