Are you looking for a quick and easy way to keep track of your stock levels? Well, you’re in luck! In this blog post, we’ll guide you through the simple steps to calculate stock levels in Google Sheets using just one easy formula. Whether you’re managing a small inventory or a large one, this method will help you stay on top of your stock with minimal effort.
Why Google Sheets is Perfect for Tracking Stock
You might be wondering why Google Sheets is such a great option for tracking stock. First of all, it’s free! Plus, it’s accessible from any device, whether you’re in the office or on the go. Most importantly, Google Sheets offers handy formulas that automate your calculations, saving you both time and energy.
Instead of manually tracking how much stock you’ve sold and how much you have left, Google Sheets can do it all for you. Sounds great, right? Let’s get started!

What Will You Learn in This Tutorial?
In this guide, you’ll learn how to calculate stock levels using a simple subtraction formula. We’ll show you how to subtract stock sold from stock added to quickly see how much stock is left for each product.
Now, let’s move on to the data we’ll be using.
Example Data: Stock Added and Stock Sold
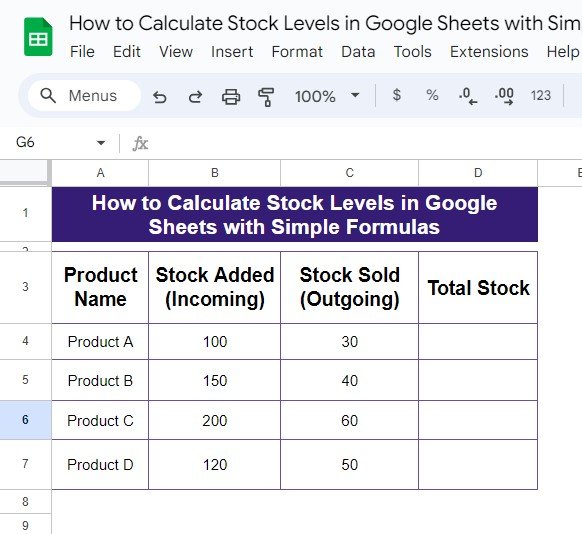
Below is the example data that we’ll be using to calculate stock levels:
As you can see, we have four products listed. For each product, we know how much stock has been added (incoming) and how much has been sold (outgoing). Now, we just need to calculate how much stock is left.
Step-by-Step Solution: The Simple Formula
The Formula to Use
The formula we’ll be using is super simple. Here it is:
=B4-C4
But what does this formula actually do? Let me explain:
B4 is the cell that holds the incoming stock (the stock that’s been added).
C4 is the cell that holds the outgoing stock (the stock that’s been sold).
By subtracting the stock sold from the stock added, we get the remaining stock.
Once you’ve entered this formula, you can drag it down for all your products, and Google Sheets will automatically calculate the total stock for each one.
What Does the Output Look Like?
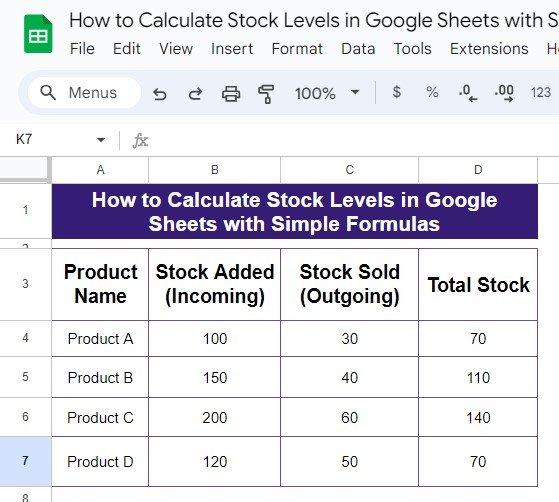
After applying the formula, here’s what your table should look like:
As you can see, Google Sheets has done all the work for us! By subtracting the stock sold from the stock added, we can see exactly how much stock is left for each product.

Why This Formula is So Useful
You might be thinking, “That was easy! But is it really that helpful?” Absolutely! This simple formula is incredibly useful, especially when you’re managing multiple products. Instead of manually calculating your stock levels every time you make a sale, Google Sheets will automatically update everything for you.
Even better, this formula works perfectly as your inventory grows. Whether you have 10 products or 1,000, you can always rely on Google Sheets to give you accurate stock levels.
Conclusion: Track Your Stock Effortlessly
And that’s it! In just a few simple steps, you’ve learned how to calculate stock levels in Google Sheets using an easy formula. No more guessing how much stock you have left—Google Sheets will handle all the calculations for you.
Visit our YouTube channel to learn step-by-step video tutorials
Youtube.com/@NeotechNavigators
View this post on Instagram


