In today’s ever-changing business world, HR departments are under constant pressure to streamline processes and make data-driven decisions. As businesses grow, the need for an efficient way to track employee performance, attendance, training hours, recruitment costs, and satisfaction becomes even more critical. This is where an HR Efficiency Monitor Dashboard proves to be an essential tool.
In this guide, we’ll show you how to create an intuitive and functional HR Efficiency Monitor Dashboard in Google Sheets. Whether you’re new to Google Sheets or have some experience, this dashboard can be easily customized to suit your company’s specific HR needs. You’ll be able to keep track of key HR metrics and make better, more informed decisions with ease.
Click to buy HR Efficiency Monitor Dashboard in Google Sheets
Table of Contents
ToggleWhat is an HR Efficiency Monitor Dashboard?
The HR Efficiency Monitor Dashboard is a visual tool that helps HR professionals manage and track key metrics such as employee performance, attendance, satisfaction, training hours, and recruitment costs. It consolidates data from different HR functions into one simple, easy-to-read dashboard. This powerful tool makes it easier for HR departments to analyze data, spot trends, and improve employee engagement and performance.
How to Set Up the HR Efficiency Monitor Dashboard in Google Sheets?
To get started, you’ll need to create three separate sheets: Dashboard Sheet, Data Sheet, and Support Sheet. Each plays a crucial role in organizing and presenting HR data.
Dashboard Sheet: Visualizing the Data
The Dashboard Sheet is where all of your key metrics are displayed through various cards and charts. These elements provide HR professionals with instant insights into the current state of HR data across your organization. Let’s break down what each of these cards and charts represent:
Cards:
- Total Training Hours: This card displays the total number of training hours completed by all employees. It provides a quick overview of how much focus is being placed on employee development.
- Total Recruitment Cost ($): This card shows the total cost incurred for recruitment efforts across the organization. It’s essential for tracking the financial side of recruitment.
Click to buy HR Efficiency Monitor Dashboard in Google Sheets
Charts:
- Attendance% (Gauge Chart): This gauge chart represents the overall attendance percentage across your organization. It provides a quick glance at how employees are performing in terms of attendance.
- Performance Score (% – Gauge Chart): This chart shows how employees are performing, based on preset targets or benchmarks.
- Employee Satisfaction Score (Gauge Chart): This gauge chart tracks how satisfied employees are with their jobs and the company overall.
- Employment Type Distribution (Pie Chart): A pie chart that breaks down the distribution of full-time, part-time, and contract employees within your company.
- Training Hours by Department (Donut Chart): This donut chart displays how many training hours have been spent in each department. It’s especially useful for identifying departments that may need more training resources.
- Recruitment Cost ($) and Attendance Rate (%) by Department (Combo Chart): This chart compares recruitment costs and attendance rates by department. This helps identify if any departments are experiencing higher recruitment costs or lower attendance rates.
- Performance Score by Job Role (Column Chart): This chart compares performance scores by job role, showing where employees excel and where improvement is needed.
- Recruitment Cost ($) by Employee Name (Area Chart): The area chart displays recruitment costs broken down by employee. This chart helps identify high-cost recruitment efforts.
- Employee Satisfaction Score by Department (Bar Chart): This bar chart tracks the employee satisfaction scores by department, allowing you to quickly pinpoint areas that require attention.
- Recruitment Cost ($) and Attendance Rate (%) by Job Role (Combo Chart): This combo chart compares recruitment costs with attendance rates by job role. It helps HR understand the relationship between recruitment investments and employee attendance.

Click to buy HR Efficiency Monitor Dashboard in Google Sheets
Data Sheet: The Foundation of Your Dashboard
The Data Sheet contains all the raw data needed for the dashboard. It’s important that this sheet is structured clearly to ensure your dashboard runs smoothly. Below are the key columns you’ll include:
- Employee Name: The name of the employee.
- Department: The department the employee belongs to (e.g., Marketing, IT, HR).
- Job Role: The specific role the employee has (e.g., Manager, Developer).
- Joining Date: The date when the employee joined the company.
- Employment Type: The type of employment (e.g., Full-Time, Part-Time, Contract).
- Attendance Rate (%): The percentage of time the employee was present at work.
- Performance Score (%): The performance score of the employee as a percentage.
- Training Hours: The total training hours completed by the employee.
- Recruitment Cost ($): The total cost spent on recruiting the employee, including advertising and agency fees.
- Employee Satisfaction Score: This score indicates how satisfied the employee is with their role and the company.
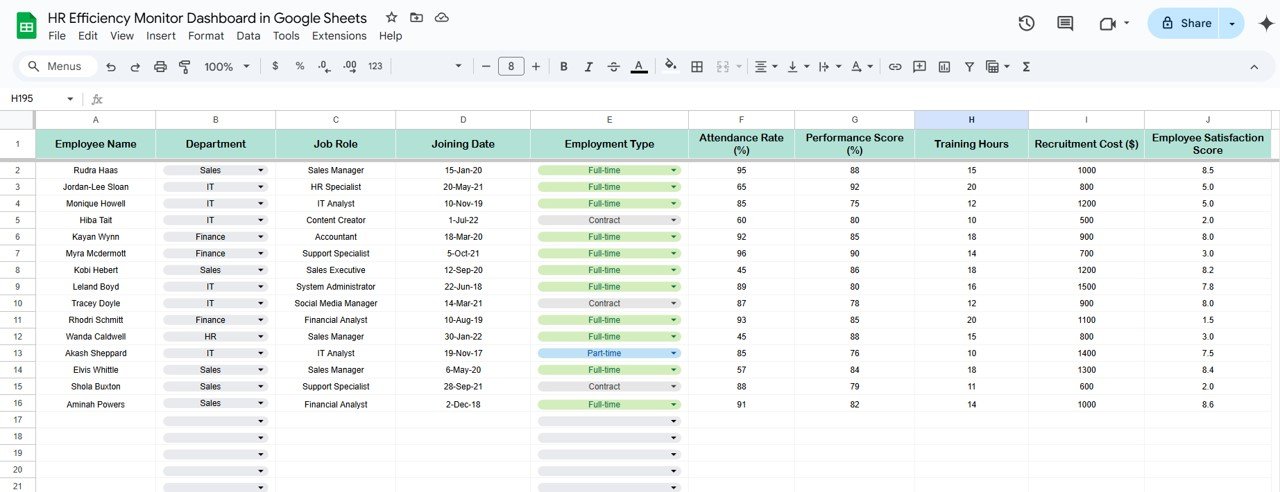
This sheet serves as the base for all the data-driven charts and cards on the dashboard.
Click to buy HR Efficiency Monitor Dashboard in Google Sheets
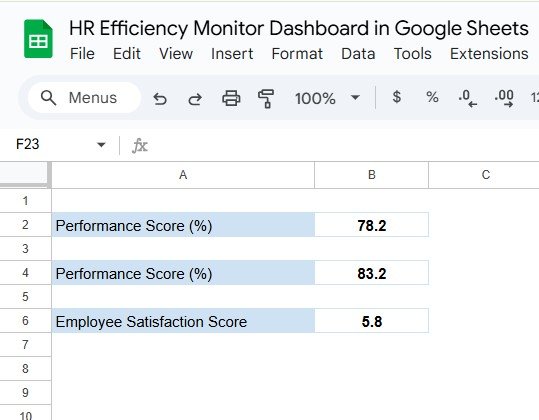
Support Sheet: Additional Insights and Benchmarks
The Support Sheet provides additional data that may help with comparisons or serve as benchmarks. For example, it may include average scores for employee performance or satisfaction. Here’s how it’s structured:
Click to buy HR Efficiency Monitor Dashboard in Google Sheets
Advantages of Using an HR Efficiency Monitor Dashboard
Implementing the HR Efficiency Monitor Dashboard can bring numerous benefits to your organization. Here are some of the advantages:
- Real-Time Data: The dashboard provides up-to-date information, allowing HR professionals to make timely decisions.
- Improved Decision-Making: By having all HR metrics in one place, it becomes easier to identify issues and trends, helping you make more informed decisions.
- Time-Saving: Automating the process of tracking and reporting saves HR professionals valuable time, which they can use for more strategic tasks.
- Enhanced Reporting: The visual charts make it simple to share HR data with senior management and other stakeholders in a clear, understandable format.
- Employee Engagement: Accurate data on performance and satisfaction allows HR to take proactive steps to improve employee engagement and retention.
Click to buy HR Efficiency Monitor Dashboard in Google Sheets
Opportunities to Improve the HR Efficiency Monitor Dashboard
While the HR Efficiency Monitor Dashboard is highly effective, there are always ways to make it even better. Here are some opportunities for improvement:
- Automation: Automating data entry and synchronization with other HR tools or systems can ensure the dashboard always reflects the most current information.
- Advanced Analytics: By integrating predictive analytics, HR can forecast future trends and potential challenges, allowing for proactive measures.
- Customization: Allow greater flexibility to customize the dashboard for different departments or roles, so HR managers can focus on the most relevant data.
- User Access Control: Implement user access restrictions to control who can view and edit the data, ensuring security and privacy.
Best Practices for Creating an HR Efficiency Monitor Dashboard
To get the most out of your HR Efficiency Monitor Dashboard, consider the following best practices:
- Simplicity is Key: Make sure the dashboard is clean and easy to navigate. Avoid clutter and focus on presenting the most important data.
- Clear Labels and Titles: Each chart and card should be clearly labeled so users know exactly what they’re looking at.
- Update Data Regularly: Ensure that the data is refreshed regularly to maintain accuracy. Set a schedule for regular updates to keep the dashboard relevant.
- Consistency: Make sure that all data is formatted in a consistent way across the Data Sheet and Dashboard Sheet to avoid errors or misinterpretations.
- Share Insights: Use the dashboard to share valuable insights with department heads and senior leadership, helping them make data-driven decisions.
Conclusion
Click to buy HR Efficiency Monitor Dashboard in Google Sheets
The HR Efficiency Monitor Dashboard in Google Sheets is an invaluable tool for any HR department. It allows you to track key metrics like attendance, performance, employee satisfaction, training hours, and recruitment costs all in one place. This dashboard not only saves time but also helps make more informed, data-driven decisions.
By following the best practices outlined in this guide and regularly improving the dashboard, your HR department will have the tools it needs to succeed. It will also enhance the overall employee experience and drive organizational success.
Frequently Asked Questions (FAQs)
1. What is an HR Efficiency Monitor Dashboard?
An HR Efficiency Monitor Dashboard is a tool that centralizes key HR metrics like performance, attendance, training hours, recruitment costs, and employee satisfaction into one easy-to-read dashboard. It helps HR professionals track trends and make better decisions.
2. How can I set up a dashboard in Google Sheets?
To create the HR Efficiency Monitor Dashboard, create three sheets: Dashboard, Data, and Support. Populate the Data sheet with HR data, create charts in the Dashboard sheet, and use the Support sheet to track benchmarks and additional data.
3. Can I customize the HR Efficiency Dashboard for my organization?
Absolutely! You can modify the dashboard to reflect the unique KPIs and metrics that matter most to your organization. Adjust the charts, add new data points, and customize the layout to fit your needs.
4. How often should I update the data in the dashboard?
It’s best to update the dashboard regularly—weekly or monthly—to ensure that the data is always current and accurate.
5. What key metrics should be tracked on the HR Efficiency Monitor Dashboard?
Key metrics typically include attendance rates, performance scores, training hours, recruitment costs, employee satisfaction, and departmental data.
6. Can I use the HR Efficiency Dashboard to track HR trends?
Yes! The dashboard is ideal for tracking HR trends over time. With regular updates, you can monitor employee performance, satisfaction, and other key areas, spotting trends early on to address issues before they escalate.
Visit our YouTube channel to learn step-by-step video tutorials
Youtube.com/@NeotechNavigators
Watch the step-by-step video tutorial:
Click to buy HR Efficiency Monitor Dashboard in Google Sheets