In today’s digital world, influencer marketing has become one of the most effective strategies to promote products, services, and brands. Tracking the success of influencer marketing campaigns is crucial for businesses to measure their return on investment (ROI) and optimize future strategies. This is where the Influencer Marketing KPI Dashboard in Google Sheets comes in. It offers a comprehensive view of key performance indicators (KPIs), providing real-time insights into campaign performance. In this article, we will explain the features of this dashboard, the key KPIs, and how it helps businesses manage their influencer marketing efforts effectively.
What is the Influencer Marketing KPI Dashboard?
The Influencer Marketing KPI Dashboard in Google Sheets is a tool designed to track and measure the effectiveness of influencer marketing campaigns. It helps businesses monitor various metrics related to influencer collaborations, such as engagement rates, conversions, reach, and more. This dashboard is fully customizable and can be tailored to your specific campaign goals.
The dashboard includes several worksheets that provide detailed insights into each KPI and offer a holistic view of your influencer marketing efforts.
Key Features of the Influencer Marketing KPI Dashboard
The dashboard is divided into six powerful worksheets that track key performance metrics. Here’s an overview of each worksheet and its features:
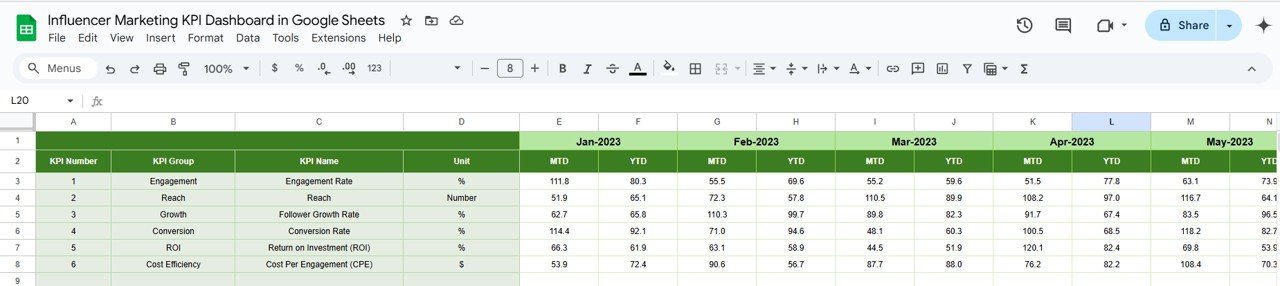
1. Dashboard Sheet Tab
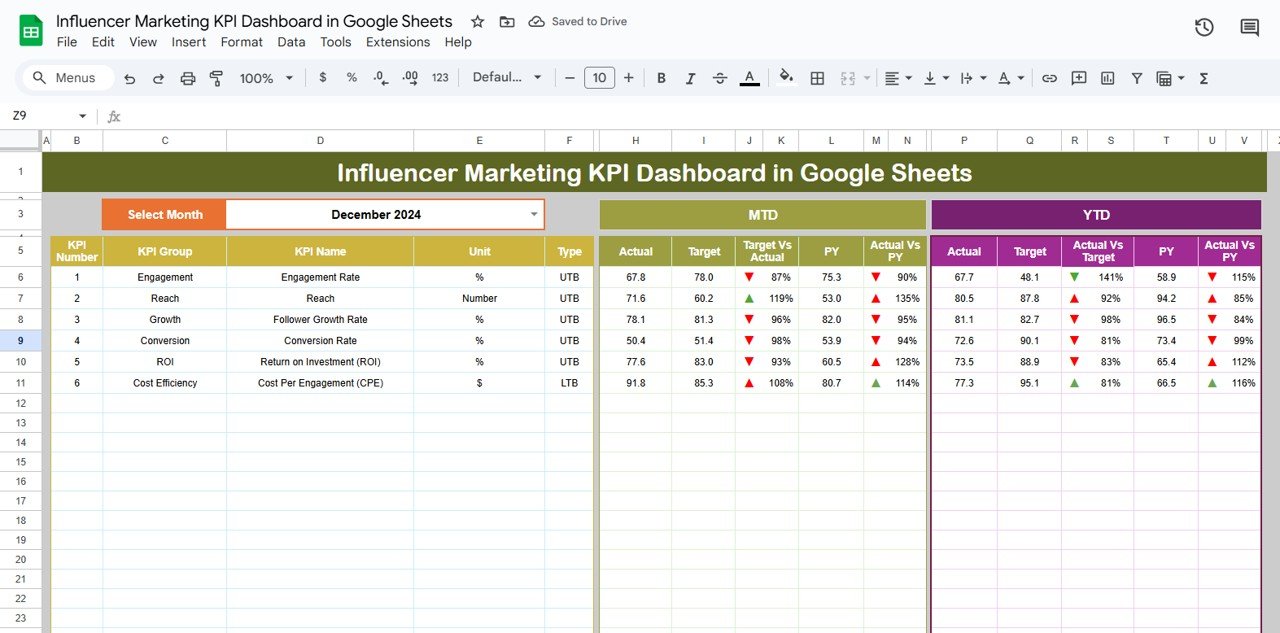
The Dashboard Sheet serves as the main overview of the dashboard. Here you will find a snapshot of all your KPIs, including:
-
MTD (Month-to-Date) Actuals: Displays actual performance data for the current month.
-
YTD (Year-to-Date) Actuals: Displays actual performance data for the year-to-date.
-
Target vs. Actual: Compares your performance against the set targets for both MTD and YTD.
-
Previous Year (PY) vs. Actual: Shows a comparison of current performance against previous year’s data with conditional formatting (up/down arrows).
You can select the desired month from a dropdown (Range D3), and the entire dashboard will update accordingly.
Click to buy Influencer Marketing KPI Dashboard in Google Sheets
2. KPI Trend Sheet Tab
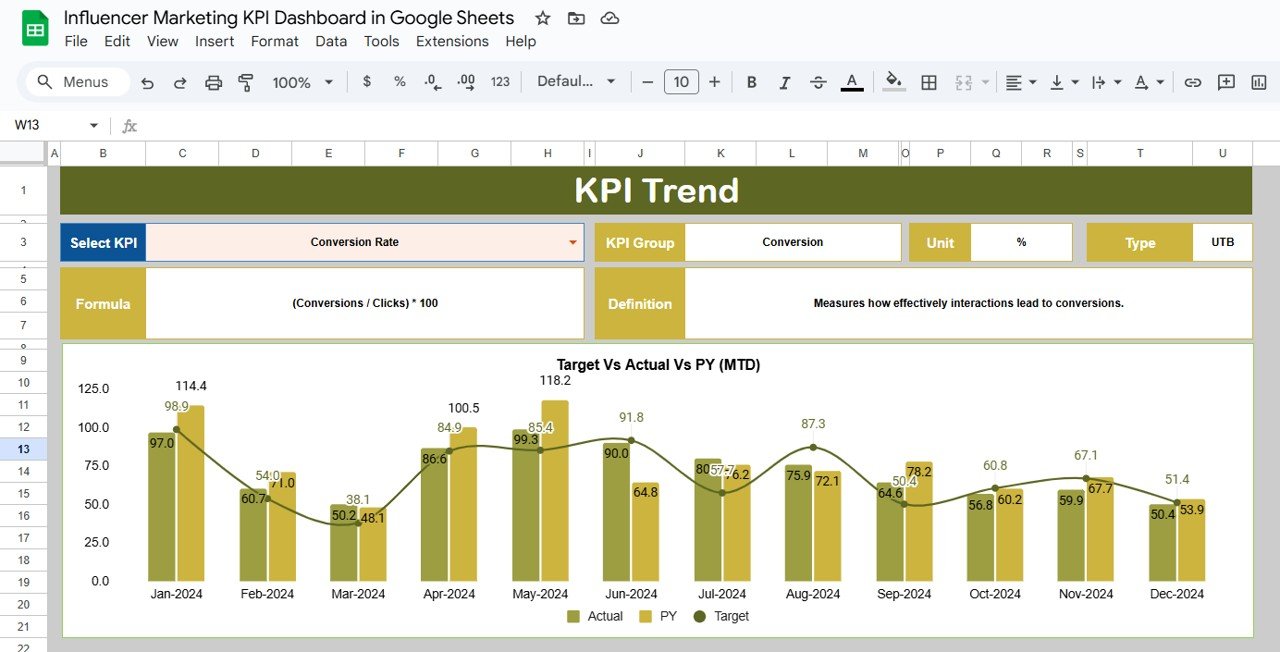
The KPI Trend Sheet allows you to select a specific KPI from a dropdown (Range C3). This sheet displays:
-
KPI Group: The category the KPI belongs to (e.g., Engagement, Conversion).
-
Unit of KPI: The unit of measurement for the KPI (e.g., percentage, count, etc.).
-
KPI Type: Whether the KPI is “Lower the Better” (LTB) or “Upper the Better” (UTB).
-
Formula: The formula used to calculate the KPI.
-
Definition: A brief description of the KPI and what it measures.
3. Actual Number Sheet Tab
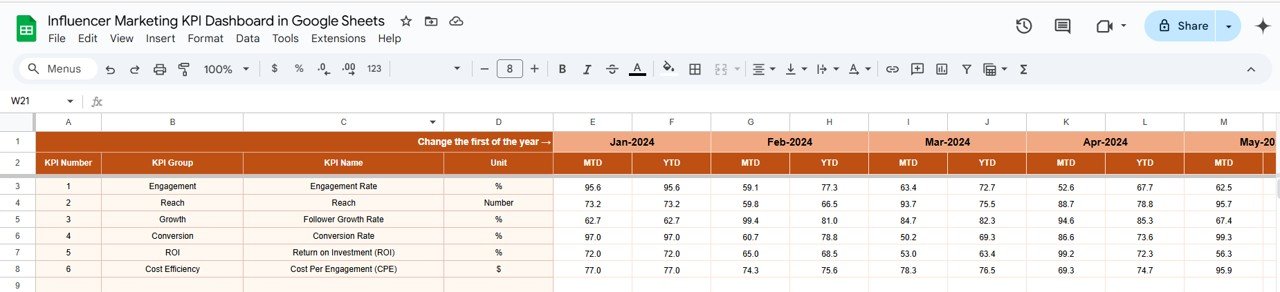
In the Actual Number Sheet, you will input the actual data for both MTD and YTD. This sheet allows you to change the month (Range E1), and once the first month of the year is entered, the rest of the data for that month will populate automatically.
Click to buy Influencer Marketing KPI Dashboard in Google Sheets
4. Target Sheet Tab
In the Target Sheet, you will enter the target values for each KPI. You can set both MTD and YTD targets for every metric, allowing you to measure performance against your campaign goals.
5. Previous Year Numbers Sheet Tab
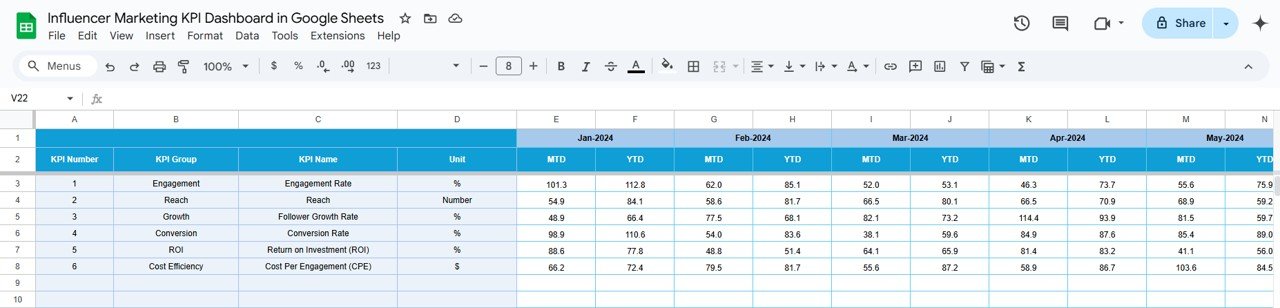
This sheet contains data for the previous year’s performance, helping you compare current campaign performance with historical data. You will enter the data here just like you did in the Actual Number Sheet.
Click to buy Influencer Marketing KPI Dashboard in Google Sheets
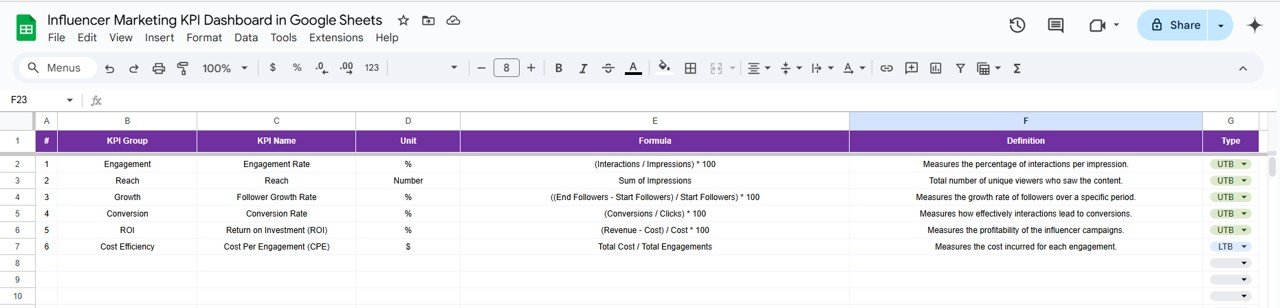
6. KPI Definition Sheet Tab
The KPI Definition Sheet provides definitions for all the KPIs used in the dashboard. It includes:
-
KPI Name
-
KPI Group
-
Unit of Measurement
-
Formula
-
KPI Definition
Advantages of Using the Influencer Marketing KPI Dashboard
-
Real-Time Data: The dashboard provides real-time insights into influencer campaign performance, allowing for timely adjustments.
-
Easy Comparisons: Compare current performance with previous year data and set targets to gauge success.
-
Customizable: The dashboard can be tailored to fit specific KPIs and campaign goals, making it versatile.
-
Clear Visuals: With charts and visual representations of data, it’s easier to understand complex metrics.
-
Comprehensive Overview: The dashboard aggregates all influencer marketing data into one place, giving you a holistic view of your campaigns.
Best Practices for Using the Influencer Marketing KPI Dashboard
Click to buy Influencer Marketing KPI Dashboard in Google Sheets
To make the most out of the Influencer Marketing KPI Dashboard in Google Sheets, follow these best practices:
-
Update Regularly: Make sure to update the dashboard with the latest data for both MTD and YTD to keep the dashboard current.
-
Set Realistic Targets: Ensure that your targets are aligned with your campaign objectives and are based on historical data.
-
Monitor Trends: Use the KPI Trend Sheet to track performance over time and identify any emerging trends.
-
Compare with Previous Year: Regularly compare the current performance with the previous year’s data to identify improvements or areas for growth.
-
Optimize Campaigns: Use insights from KPIs like CTR and Engagement Rate to refine your influencer marketing strategy.
Conclusion
The Influencer Marketing KPI Dashboard in Google Sheets is a valuable tool for tracking, analyzing, and optimizing influencer marketing campaigns. By providing key insights into performance metrics like engagement rates, conversions, and ROI, this dashboard helps businesses make data-driven decisions to improve their influencer marketing strategies. Whether you’re running one campaign or multiple influencer partnerships, this dashboard is an essential resource for ensuring that your campaigns achieve their full potential.
Frequently Asked Questions (FAQs)
Click to buy Influencer Marketing KPI Dashboard in Google Sheets
1. What is the purpose of the Influencer Marketing KPI Dashboard?
The Influencer Marketing KPI Dashboard tracks the performance of influencer marketing campaigns, providing key metrics such as engagement rates, ROI, and conversions.
2. Can I customize the KPIs in the dashboard?
Yes, the dashboard is fully customizable. You can add new KPIs, adjust formulas, or modify the existing metrics to suit your campaign needs.
3. How do I update the dashboard with the latest data?
You can update the dashboard by entering the latest data in the Actual Number Sheet and Target Sheet for both MTD and YTD.
4. How often should I update the dashboard?
The dashboard should be updated regularly—ideally weekly or monthly—depending on the frequency of your campaigns and the amount of data you collect.
5. Can I track multiple campaigns in this dashboard?
Yes, you can track multiple influencer campaigns by adding separate data for each campaign and adjusting the formulas accordingly.
Visit our YouTube channel to learn step-by-step video tutorials
Youtube.com/@NeotechNavigators
Watch the step-by-step video Demo:
Click to buy Influencer Marketing KPI Dashboard in Google Sheets