The Integrated Mining Operations Dashboard in Google Sheets pulls 4 financial KPI cards, 20 charts and 5 interactive analysis pages into one connected file — covering production, downtime, safety, ESG and profitability. Slicers sit at the top of every page, so a single click filters every chart and card by mine site, company, equipment type, ore type or country.
Most mining teams stitch this picture together across several spreadsheets and a paid BI seat that costs $15–75 per user each month. This Integrated Mining Operations Dashboard in Google Sheets replaces that with a one-time $9.99 file that runs natively in the browser, needs no add-ons, and shares with the whole team through a single Google Drive link.
Key Features of the Integrated Mining Operations Dashboard in Google Sheets
- Tracks 4 headline KPIs — Total Cost, Revenue, Profit and Processing Cost — on the Overview page.
- Delivers 20 pre-built charts across 5 connected analysis pages.
- Slicers on every page filter by mine site, company, equipment type, ore type, department and country.
- Runs natively in Google Sheets — no add-ons, no macros, works in any browser on desktop or mobile.
- A dedicated Safety & ESG page reports CO2e (t), safety incidents and waste by company and equipment type.
- Replace the rows on the Data sheet and every card, chart and slicer recalculates automatically.
Dashboard Pages Explanation
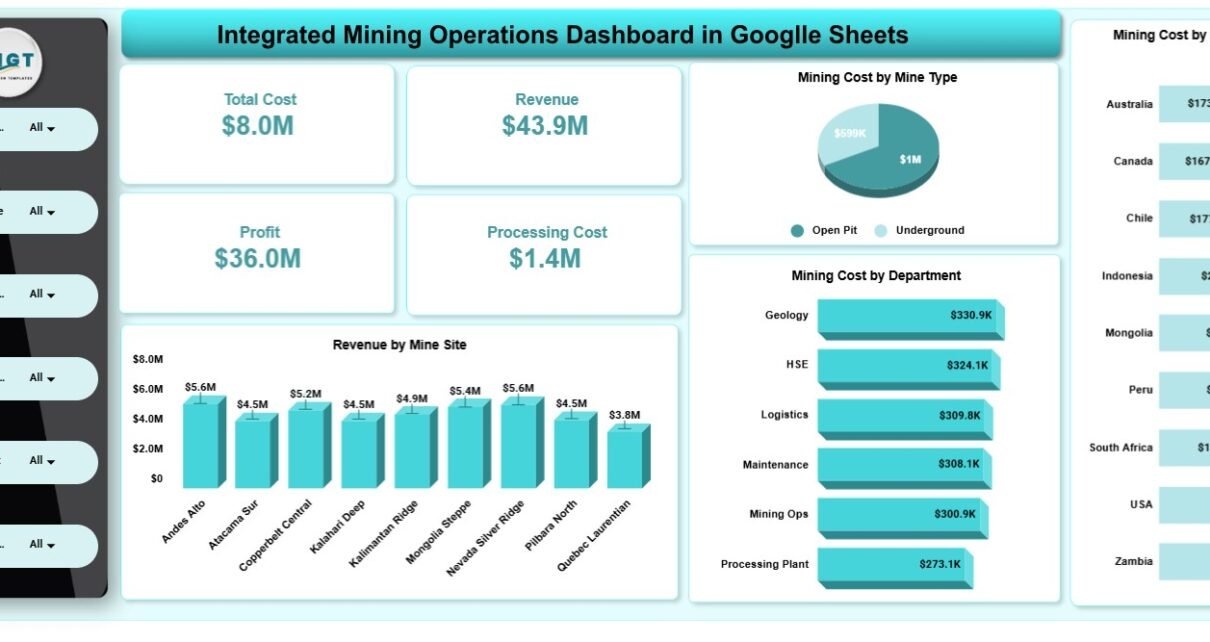
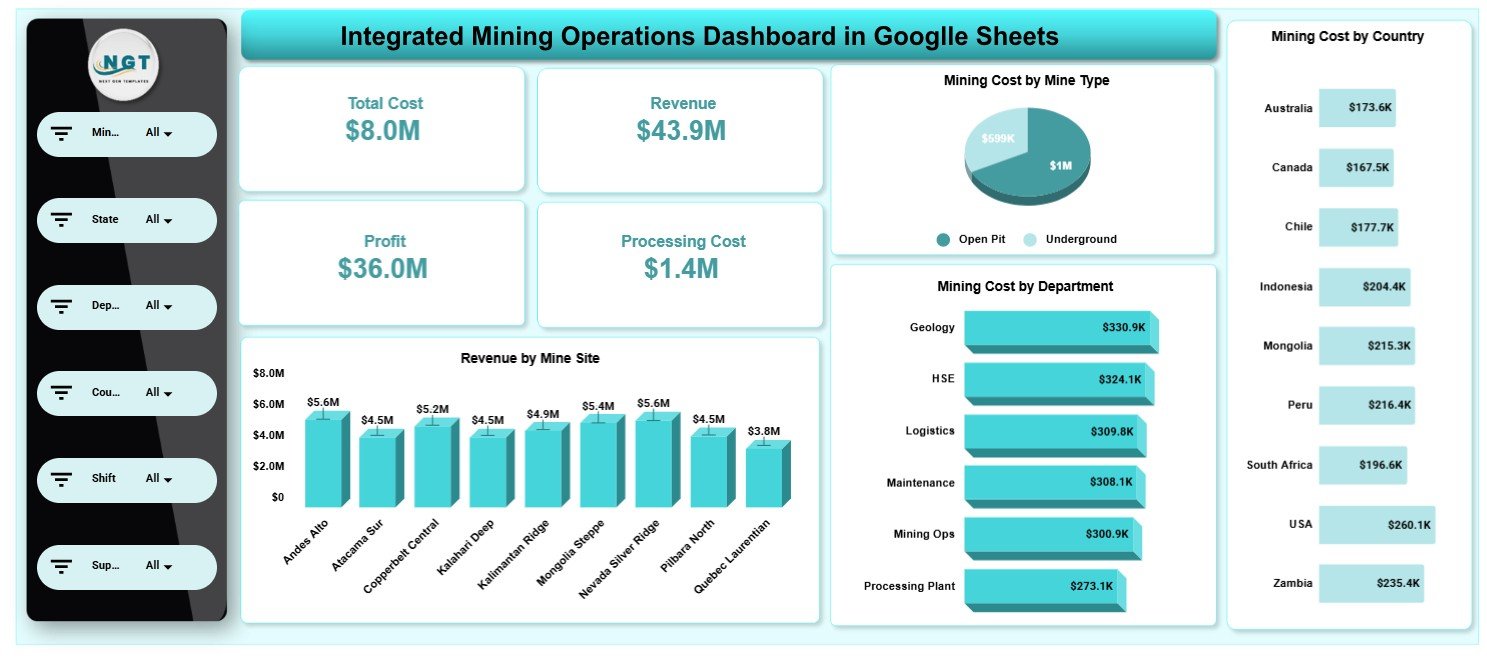
Page 1: Overview
The Overview page leads with four KPI cards — Total Cost, Revenue, Profit and Processing Cost — then charts Mining Cost by Mine Type, Mining Cost by Department, Mining Cost by Country and Revenue by Mine Site. Slicers filter the whole page in one click.
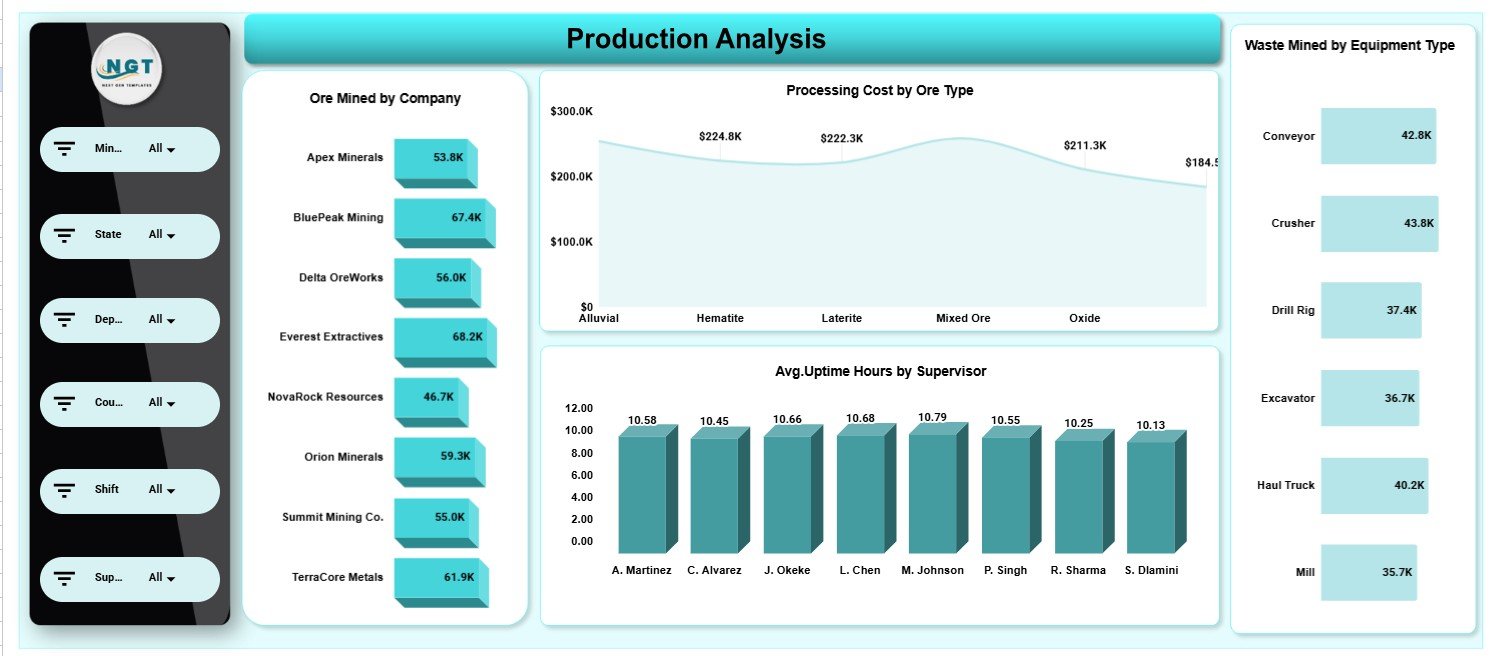
Page 2: Production Analysis
The Production Analysis page shows Ore Mined by Company, Processing Cost by Ore Type, Avg. Uptime Hours by Supervisor and Waste Mined by Equipment Type, so you can compare which crews and machines deliver the most usable ore.
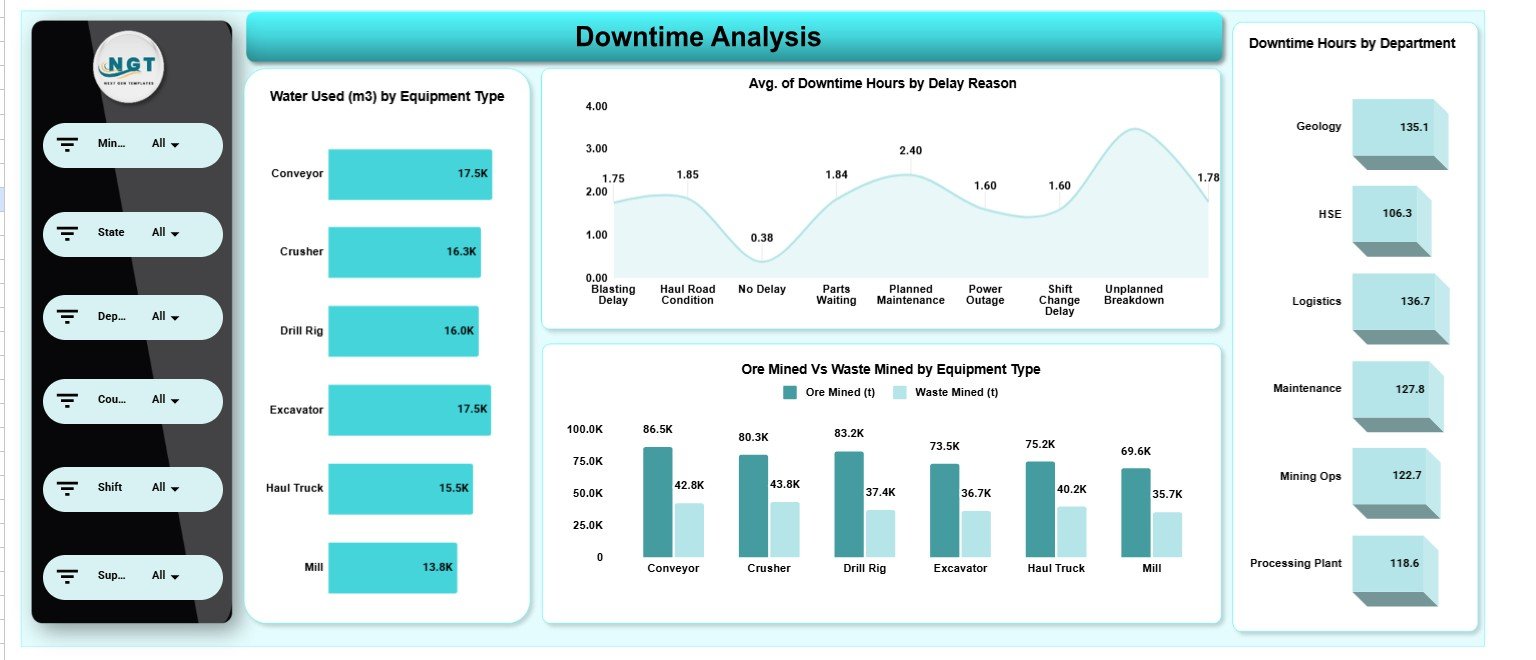
Page 3: Downtime Analysis
The Downtime Analysis page tracks Water Used (m3) by Equipment Type, Avg. of Downtime Hours by Delay Reason, Ore Mined vs Waste Mined by Equipment Type and Downtime Hours by Department, highlighting where lost hours and resource use concentrate.
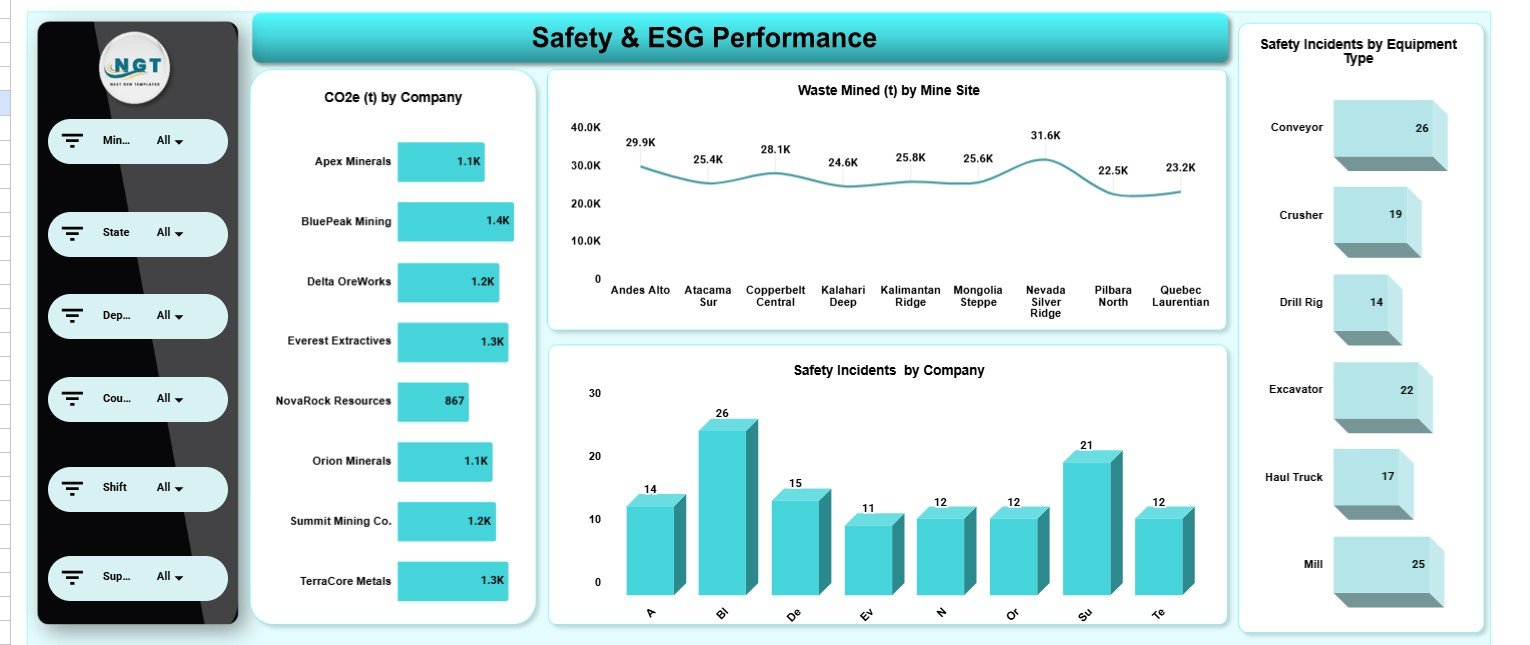
Page 4: Safety & ESG Performance
The Safety & ESG Performance page reports CO2e (t) by Company, Waste Mined (t) by Mine Site, Safety Incidents by Company and Safety Incidents by Equipment Type — the core metrics for mining ESG and compliance reporting.
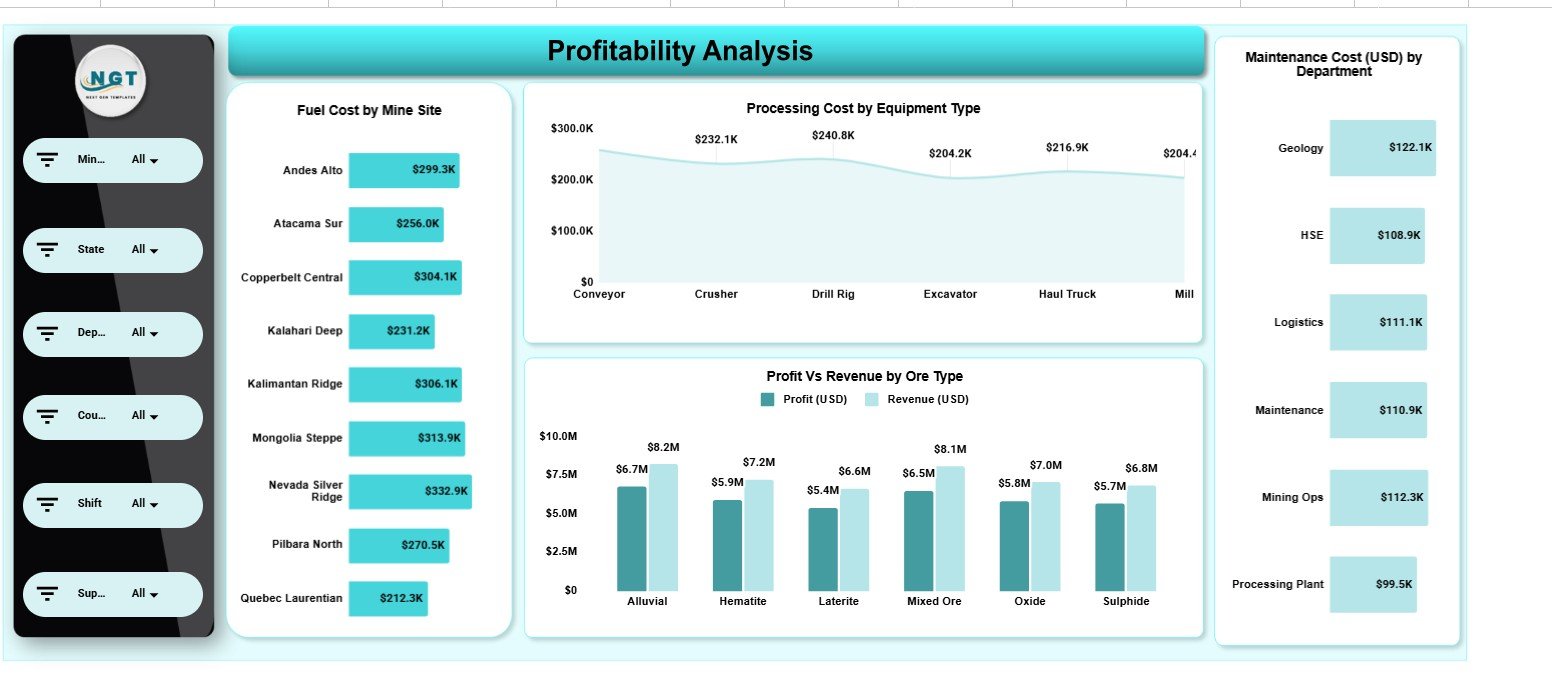
Page 5: Profitability Analysis
The Profitability Analysis page links cost to return with Fuel Cost by Mine Site, Processing Cost by Equipment Type, Profit vs Revenue by Ore Type and Maintenance Cost (USD) by Department, revealing which sites and ore types actually drive margin.
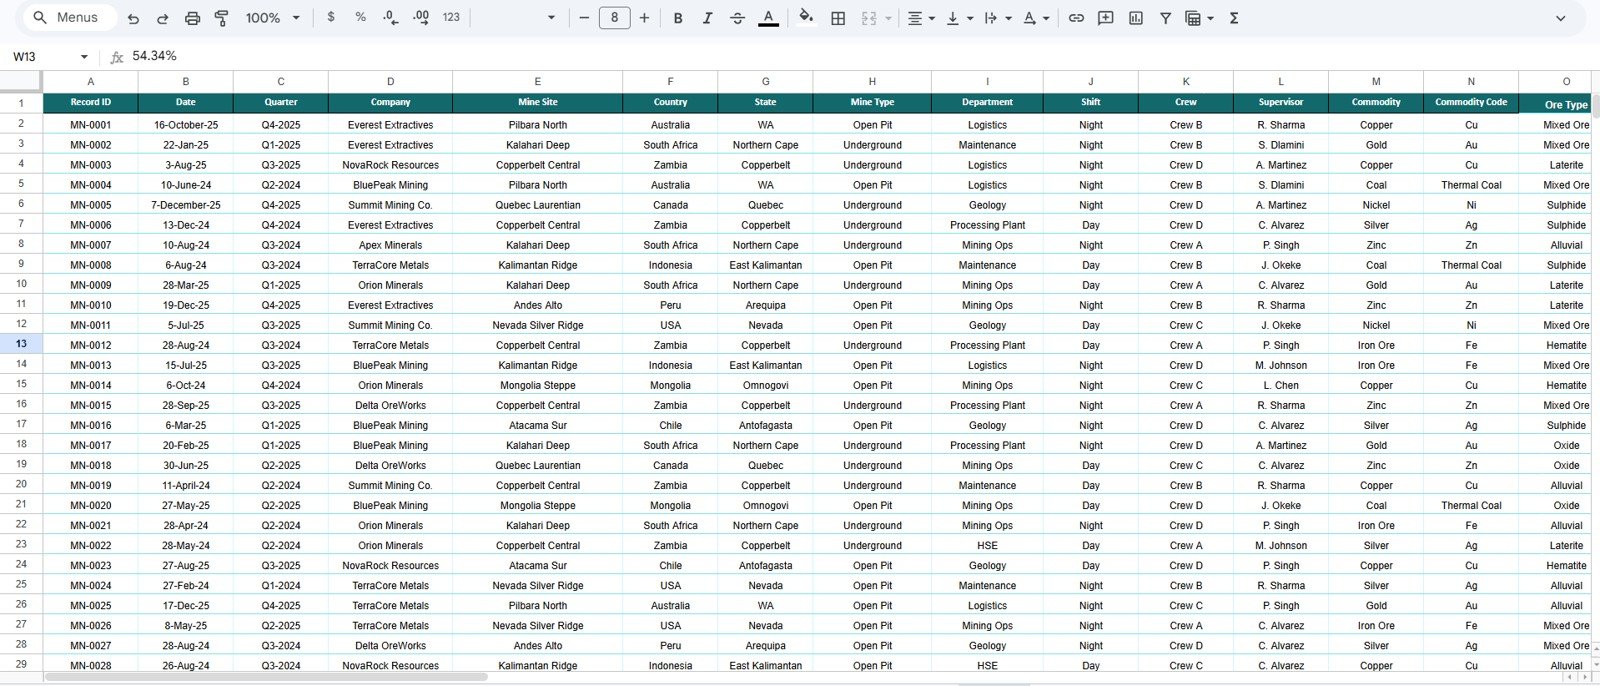
Data Sheet
The Data sheet stores every record in a clean, structured layout. Paste your own mining operations data in the same column order and all five analysis pages, KPI cards and slicers refresh automatically.
Integrated Mining Operations Dashboard in Google Sheets vs Microsoft Excel vs Paid BI SaaS — Feature Comparison
| Feature | Integrated Mining Operations Dashboard (Google Sheets) | Microsoft Excel Dashboard | Paid BI SaaS (Tableau / Power BI Premium) |
|---|---|---|---|
| Cost | $9.99 one-time | $10–25 one-time + Office licence | $15–75 / user / month |
| Platform | Native Google Sheets (browser) | Desktop Excel | Cloud BI platform |
| Setup time | Under 10 minutes | Under 15 minutes | Days to weeks |
| Real-time team collaboration | Built in | Limited | Yes |
| Mobile access | Any browser | Excel mobile only | Yes |
| Slicer filtering | On every page | Yes | Yes |
| Share with a link | Google Drive link | File transfer needed | Yes |
| Year-1 cost at 5 users | $9.99 total | Office licences ×5 | $900–4,500 |
For mining teams that want a connected production, cost, safety and ESG view without paying per-user BI fees, the Integrated Mining Operations Dashboard in Google Sheets sits in the sweet spot.
Who Should Use This Template
Perfect for:
- Mine managers and operations leads tracking cost, output and uptime across multiple sites.
- HSE and ESG officers reporting CO2e, safety incidents and waste.
- Finance and cost controllers analysing profit, fuel and maintenance by site and ore type.
- Small and mid-size mining and quarrying operators who want analytics without a BI subscription.
Not a fit if:
- You need a live IoT/SCADA sensor feed streaming into the dashboard.
- You require row-level security, SSO and audit logging across thousands of users.
- Your operation cannot use Google Workspace at all.
Real-World Use Cases
Daniel runs operations for a three-site aggregates company. Each month he compares Mining Cost by Mine Type and Revenue by Mine Site on the Overview page, then drills into Downtime Hours by Department to decide where an extra maintenance shift will pay off fastest.
Priya is the HSE lead at a metals miner. She filters the Safety & ESG page by company to present CO2e (t) and Safety Incidents by Equipment Type to her board, replacing a separate ESG reporting tool with one shareable Google Sheets file.
Marcus is a cost controller at a coal operation. He leans on the Profitability Analysis page to read Profit vs Revenue by Ore Type and Maintenance Cost by Department, exposing the ore types that quietly erode margin.
Advantages of the Integrated Mining Operations Dashboard in Google Sheets
The biggest advantage is cost: a one-time $9.99 purchase against $900–4,500 a year for a five-seat BI subscription. Because it is native Google Sheets, there is nothing to install and updates are instant when you edit the Data sheet. Real-time collaboration means site, finance and HSE teams work from the same numbers, and slicer filtering turns a static report into a tool people actually explore. You also keep full ownership of your data — it lives in your own Google Drive.
Opportunities for Improvement
Honest limitations: the dashboard reads from a manually updated Data sheet, so it is not a real-time SCADA or sensor feed — someone has to paste in fresh records. Google Sheets also slows down with very large datasets (hundreds of thousands of rows), so high-volume operations may want to summarise data before loading it. Finally, it does not include user-level permissions beyond standard Google Drive sharing, which enterprises with strict access controls should keep in mind.
Best Practices
- Keep the Data sheet column order intact — the charts and slicers reference those columns.
- Update records on a fixed cadence (daily or weekly) so trends stay comparable.
- Use a copy for each reporting period if you want a historical archive.
- Learn how slicers and filters work in Google Sheets to get the most from the filtering on each page.
Explore Relevant Templates
- Mining Dashboard in Google Sheets — a lighter mining analytics view.
- Mining KPI Scorecard in Google Sheets — actual-vs-target scorecard for mining KPIs.
- Mining Safety KPI Dashboard in Google Sheets — a deeper safety-focused view.
- Energy Trading KPI Dashboard in Google Sheets — for commodity and trading teams.
- Precious Metals KPI Dashboard in Google Sheets — metals-specific KPI tracking.
Frequently Asked Questions
What KPIs does the Integrated Mining Operations Dashboard in Google Sheets track?
The Integrated Mining Operations Dashboard in Google Sheets tracks 4 headline KPIs — Total Cost, Revenue, Profit and Processing Cost — plus 20 charts covering production, downtime, fuel, maintenance, safety incidents, CO2e and waste across companies, sites and equipment.
Do I need Excel or any add-ons to use it?
No. The Integrated Mining Operations Dashboard in Google Sheets runs natively in Google Sheets with no add-ons or macros. You only need a free Google account and any modern browser on desktop or mobile.
How long does setup take?
Setup takes under 10 minutes. Make your own copy of the Integrated Mining Operations Dashboard in Google Sheets, paste your records into the Data sheet in the same format, and every card, chart and slicer recalculates automatically.
How does this compare to a paid BI tool like Tableau or Power BI Premium?
Paid BI platforms cost $15–75 per user each month. The Integrated Mining Operations Dashboard in Google Sheets is a one-time $9.99 purchase with no per-user fees, covering production, cost, safety, ESG and profitability in one shareable file.
Can my whole team use it at once?
Yes. Because the Integrated Mining Operations Dashboard in Google Sheets lives in Google Drive, multiple team members can view and edit it together in real time, and you can share it with a single link.
Can I add my own mine sites and ore types?
Yes. The Integrated Mining Operations Dashboard in Google Sheets is fully editable. Add new mine sites, companies, ore types or equipment to the Data sheet and the slicers and charts expand to include them.
About the Author
Built by PK — Microsoft Certified Professional with 15+ years of Excel, Google Sheets and Power BI experience. Founder of NextGenTemplates, reaching 300K+ subscribers across YouTube channels. Every template is hand-built and tested before release.
Conclusion
If you manage a pit, plant or multi-site operation and want production, downtime, safety, ESG and profitability in one connected view, the Integrated Mining Operations Dashboard in Google Sheets gives you that without a per-user BI bill. Click here to purchase the Integrated Mining Operations Dashboard in Google Sheets.
Instant download · One-time payment · No subscription. For step-by-step video tutorials, visit YouTube.com/@NeoTechNavigators.
Last updated: June 2026