The Education Services Dashboard in Google Sheets tracks 4 headline KPIs and 20 charts across 5 interactive analysis pages, plus a Search sheet that returns 17 fields for any student the instant you pick an Enrollment ID. Seven tabs in total, native slicers on every page, and a setup time of under 10 minutes — paste your records into the Data sheet and the entire dashboard rebuilds itself.
Most coaching institutes and training centres run on three disconnected files: one for admissions, one for fee receipts, and one for attendance registers. Nobody can answer the two questions that matter — which programs are actually filling, and how much of what we billed have we actually banked. This Google Sheets education dashboard puts enrollment, revenue, academic performance, and student satisfaction into one file that any staff member can open in a browser.
Key Features of the Education Services Dashboard in Google Sheets
- 4 KPI cards — Total Enrollments, Fees Collected, Avg Attendance, and Completion Rate sit at the top of the Overview page and recalculate the moment your data changes.
- 20 charts across 5 pages — Four purpose-built charts on each analysis page, rather than one crowded summary tab that answers nothing well.
- Native Google Sheets slicers — Filter by program, department, campus, course mode, or month and every chart on that page redraws instantly.
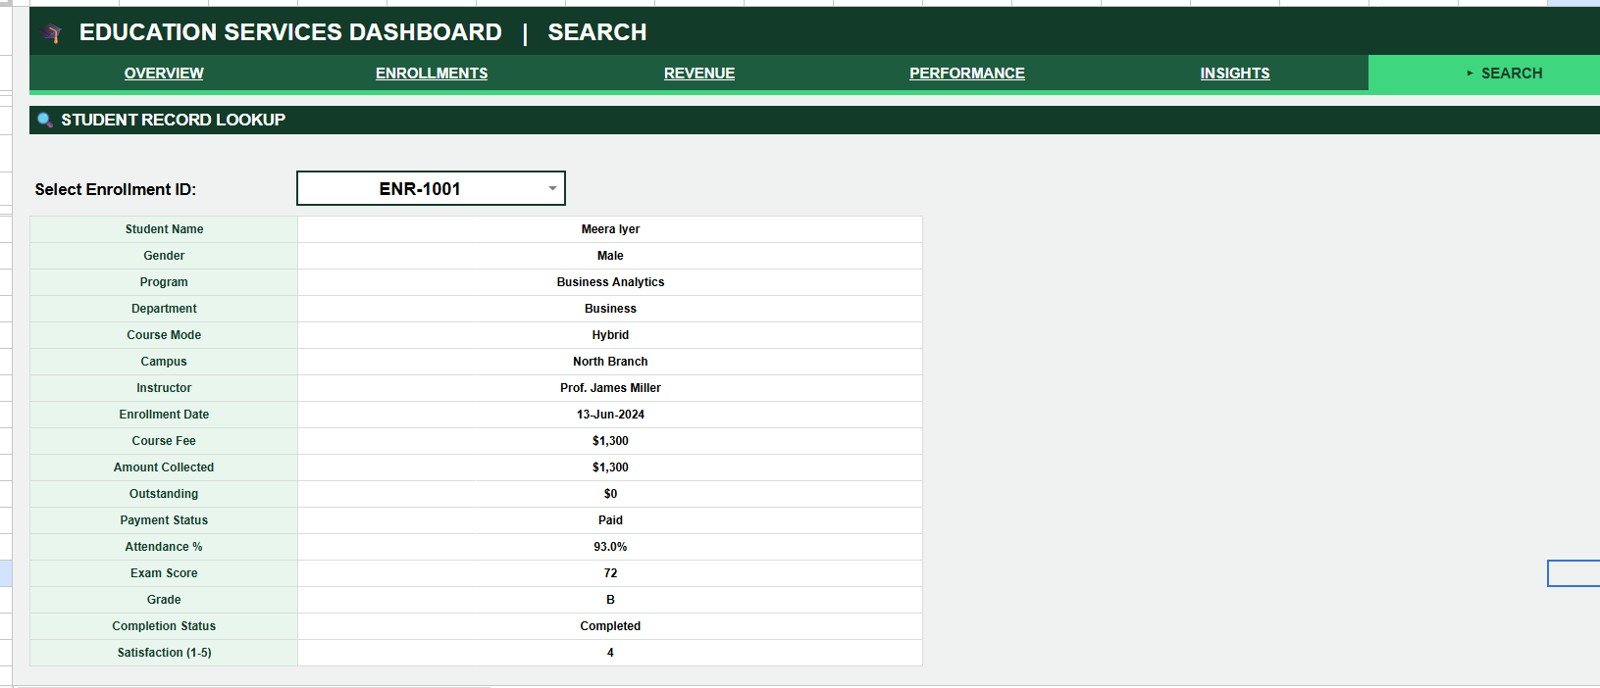
- 17-field student lookup — The Search sheet returns a complete student record from a single Enrollment ID dropdown.
- Fee recovery tracking — Collected vs Outstanding is charted by month and by department, so unpaid balances surface before the term closes.
- Browser-based — Works on Windows, Mac, Chromebook, iPad, and Android with no install and no per-seat licence.
Because the charts are built on standard Google Sheets chart ranges, they expand automatically as you add rows — there is no pivot cache to refresh and no script to authorise.
Dashboard Pages Explanation
The Education Services Dashboard in Google Sheets ships with seven tabs: five analysis pages, one Search sheet, and one Data sheet that feeds them all.
Page 1: Overview
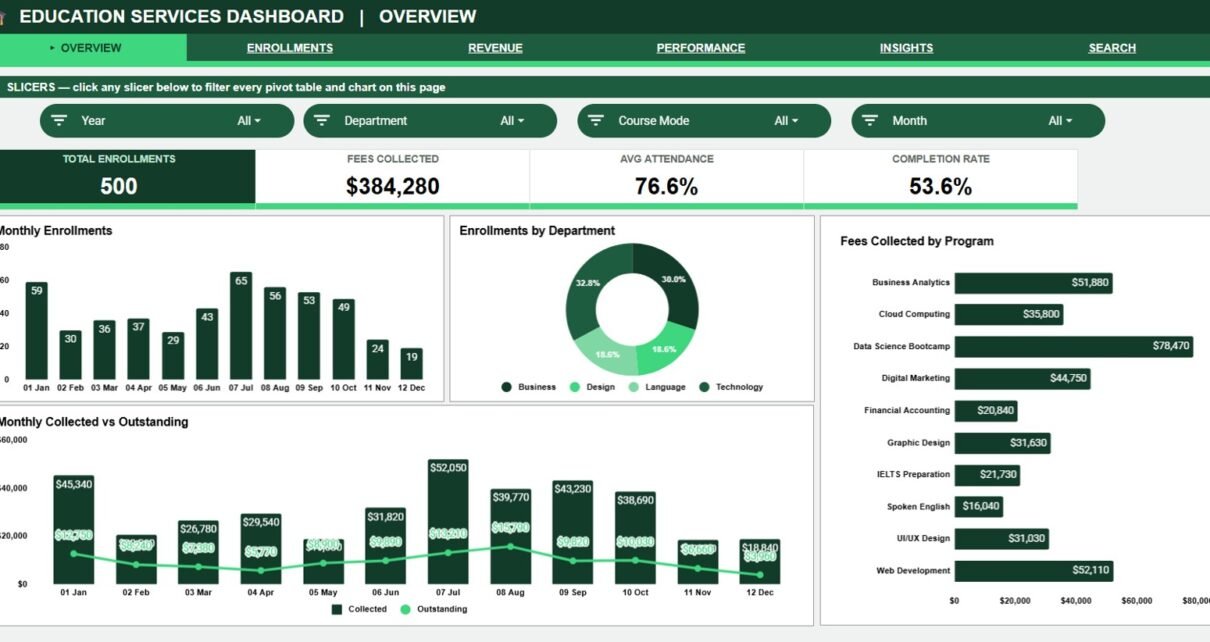
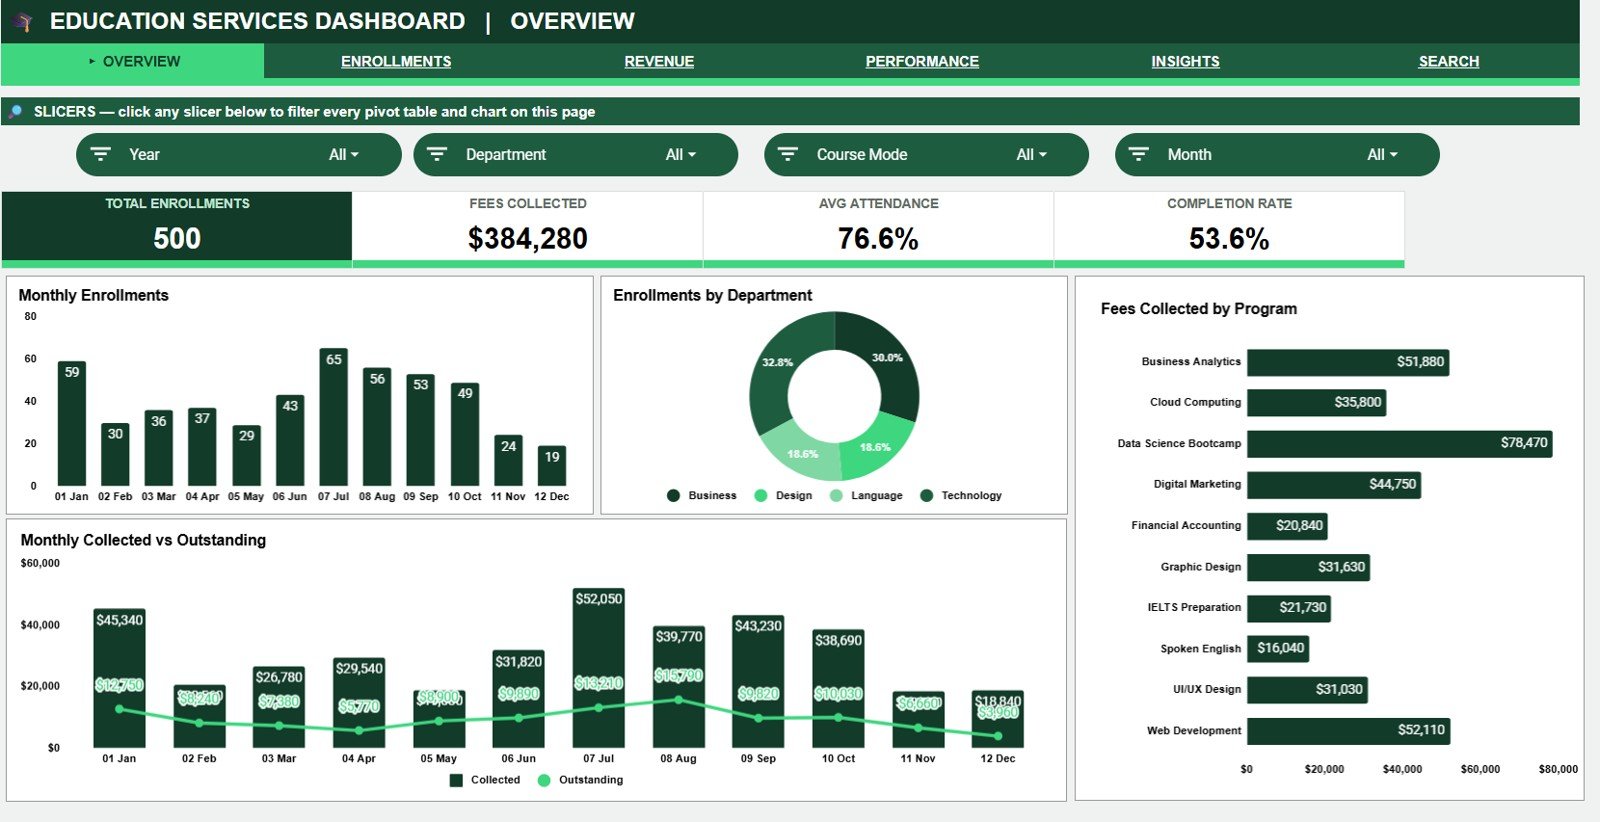
The landing page carries the 4 KPI cards — Total Enrollments, Fees Collected, Avg Attendance, and Completion Rate — above four charts: Monthly Enrollments by Month, Enrollments by Department, Fees Collected by Program, and Collected vs Outstanding by Month. The slicer row across the top filters every visual on the page at once, so a director can go from institute-wide to a single campus in one click.
Page 2: Enrollment Analysis
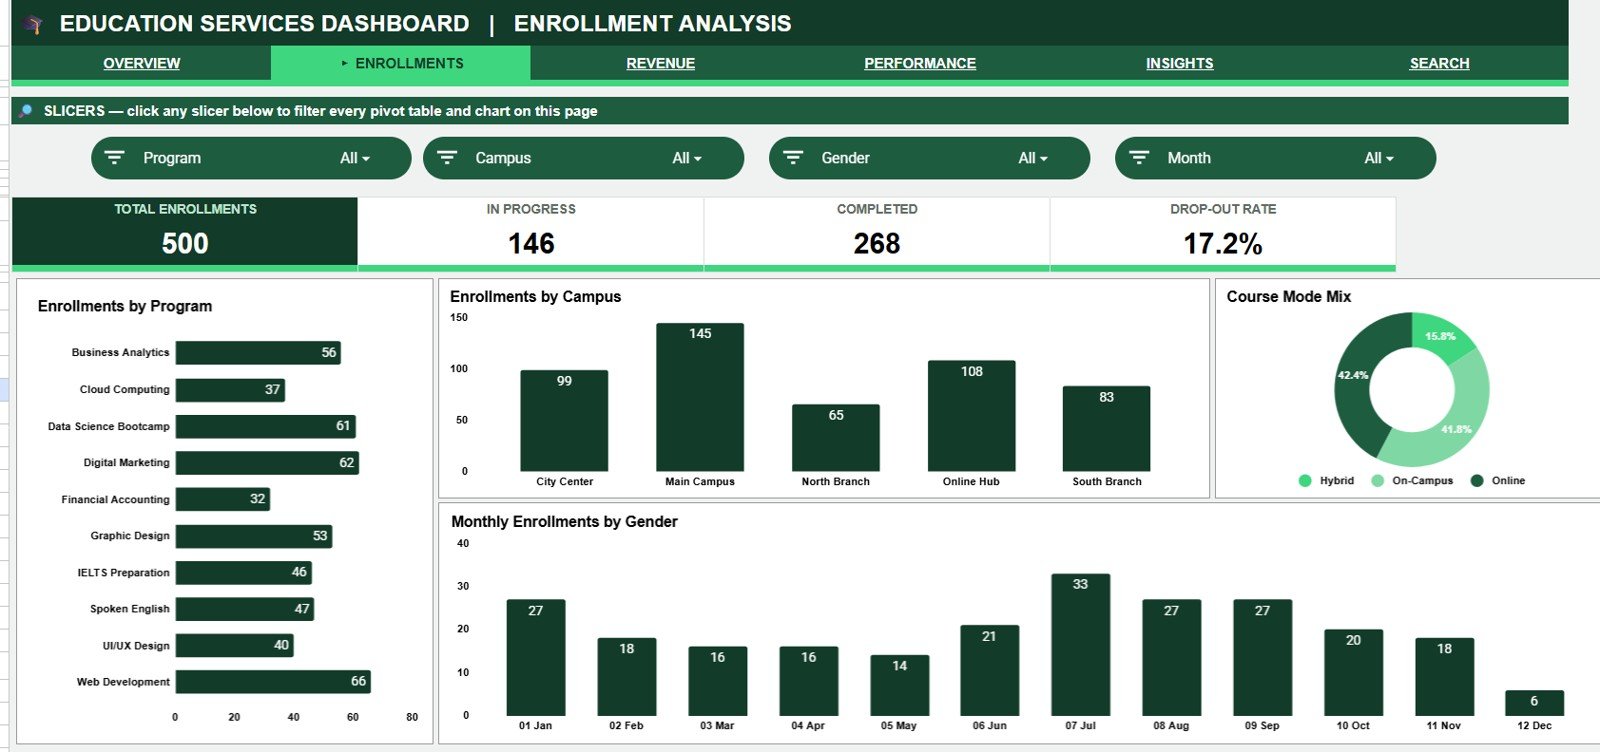
Admissions are broken down through Enrollments by Program, Enrollments by Campus, Course Mode Mix by Course Mode, and Monthly Enrollments by Gender. This is the page that tells you whether your online batches are outgrowing your on-campus ones, and which programs deserve more marketing spend next intake.
Page 3: Revenue Analysis
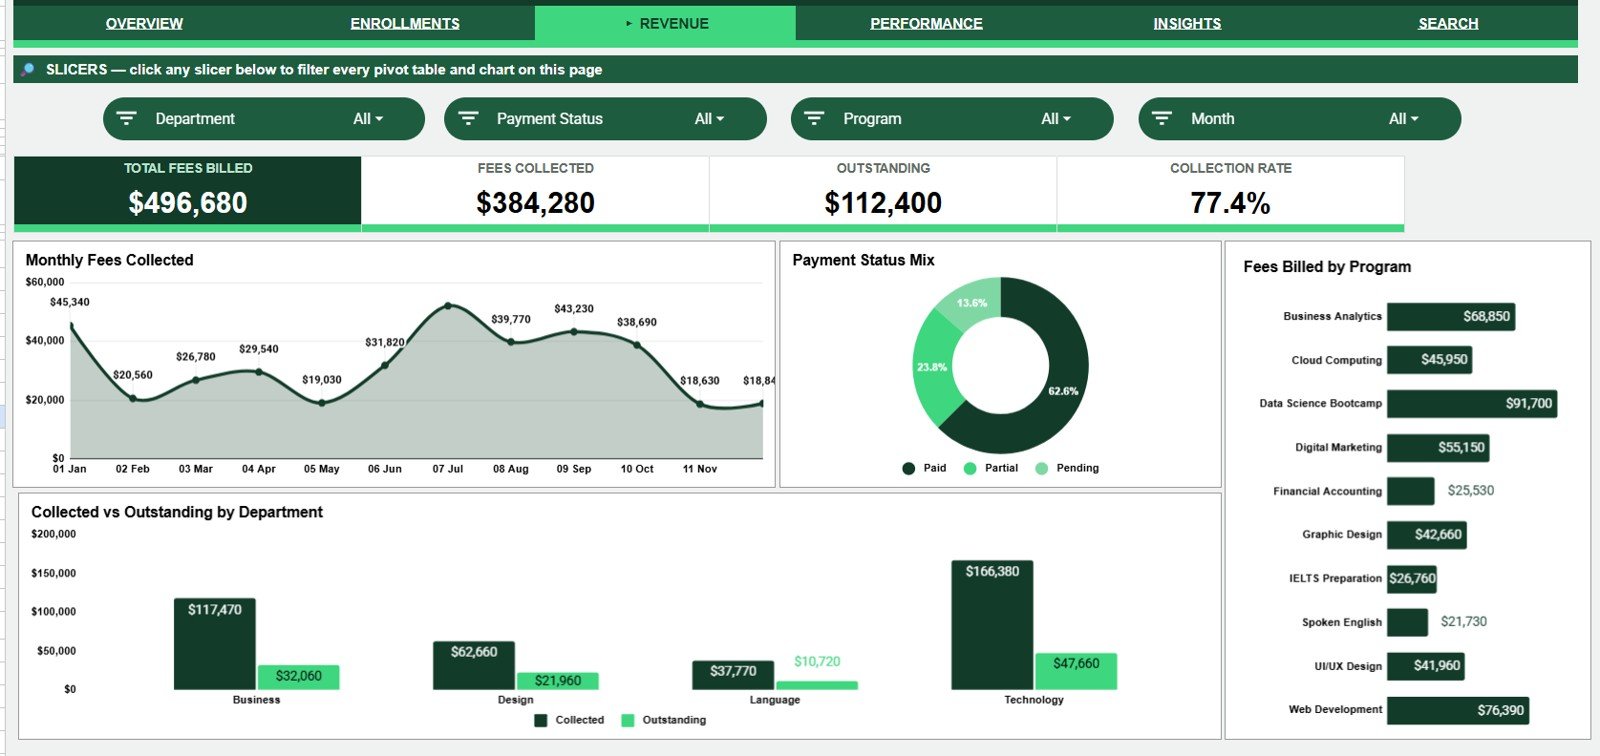
Fee performance is charted through Monthly Fees Collected by Month, Payment Status Mix by Payment Status, Collected vs Outstanding by Department, and Fees Billed by Program. It answers the question every administrator eventually gets asked in a trustee meeting: how much did we bill, and how much have we actually banked?
Page 4: Academic Performance
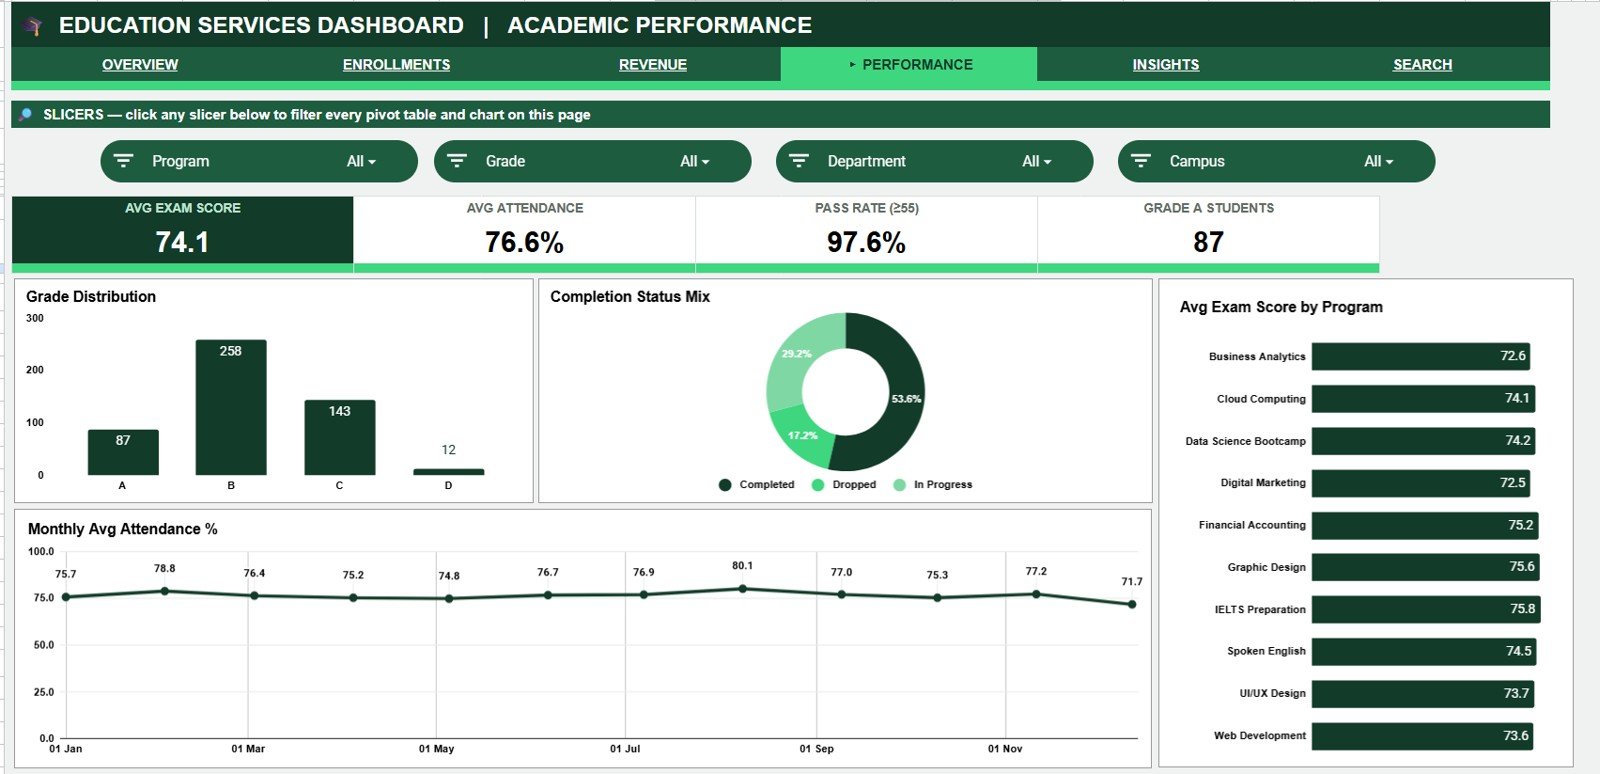
Teaching outcomes are tracked with Grade Distribution by Grade, Completion Status Mix by Completion Status, Monthly Avg Attendance % by Month, and Avg Exam Score by Program. A program with slipping attendance and falling exam scores shows up here mid-term, while you can still intervene.
Page 5: Student Insights
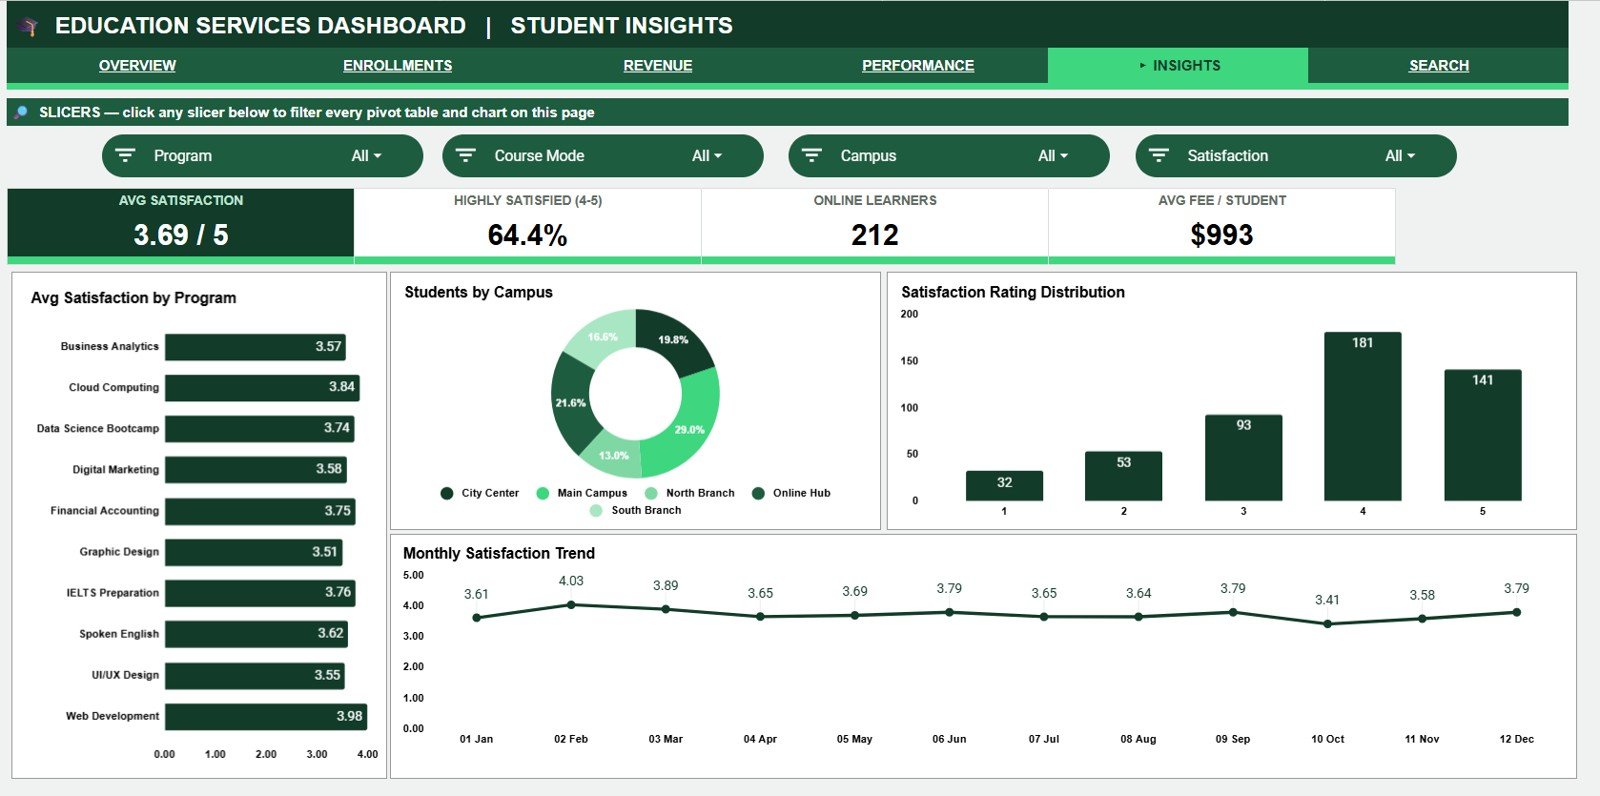
Satisfaction and campus mix are shown through Avg Satisfaction by Program, Students by Campus, Satisfaction Rating Distribution by Rating, and Monthly Satisfaction Trend by Month. Open this page before a board review or a re-enrollment campaign — a satisfaction dip almost always precedes a drop-off in renewals.
Page 6: Search Sheet
Select any Enrollment ID from the dropdown and the complete student record appears instantly — Student Name, Gender, Program, Department, Course Mode, Campus, Instructor, Enrollment Date, Course Fee, Amount Collected, Outstanding, Payment Status, Attendance %, Exam Score, Grade, Completion Status, and Satisfaction Rating. Seventeen fields, one dropdown, no scrolling through thousands of raw rows.
Page 7: Data Sheet
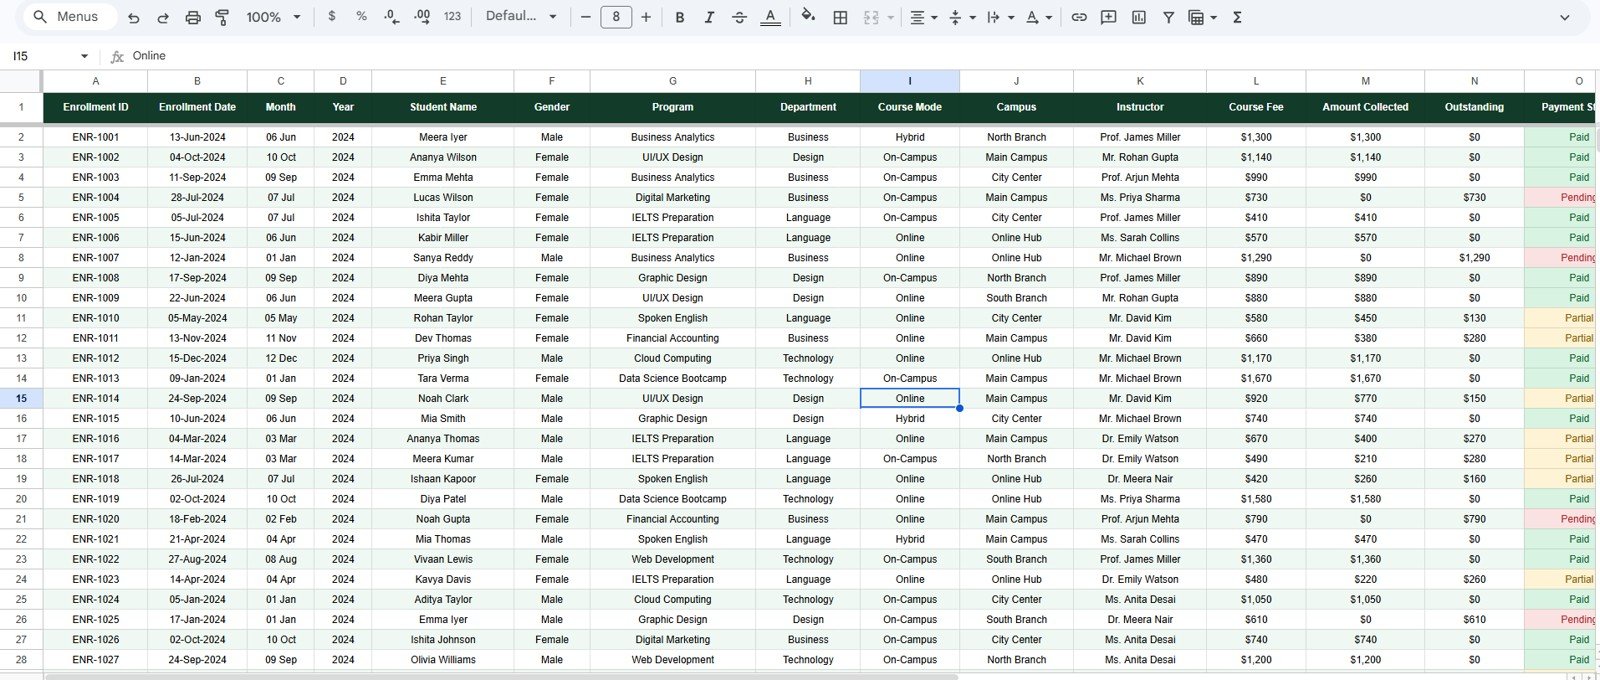
This is where your records live. Add or paste your enrollment data in the same column format as the sample rows, and all five dashboard pages plus the Search sheet update from it automatically. Keep the column order intact and everything downstream keeps working.
Education Services Dashboard in Google Sheets vs. Microsoft Excel Dashboard vs. Paid Student Information Systems — Feature Comparison
| Feature | Education Services Dashboard in Google Sheets | Microsoft Excel Dashboard | PowerSchool / Classe365 / Blackbaud |
|---|---|---|---|
| Cost | ✅ $9.99 one-time | $17.99 one-time | $8–$15 per student / year, or $99+ / month |
| Platform | ✅ Browser — Windows, Mac, Chromebook, iPad, Android | Desktop Excel (Microsoft 365) | Vendor cloud only |
| Setup time | ✅ Under 10 minutes | 10–15 minutes | 4–12 weeks implementation |
| Real-time team collaboration | ✅ Built in, unlimited editors | Requires OneDrive / SharePoint | Included (per-seat) |
| Mobile access | ✅ Free Google Sheets app | Excel mobile (365 subscription) | Vendor app |
| Customisable fields & charts | ✅ Full — edit any column, chart, or slicer | Full | Limited to vendor schema |
| Share with a link | ✅ Yes — any Google account | Via OneDrive | Per-seat licence required |
| Year-1 cost for 5 staff | ✅ $9.99 total | $17.99 total | $1,200–$6,000+ |
| Enrollment + fees + attendance + grades in one file | ✅ Yes — 5 linked pages | Yes | Usually separate paid modules |
For coaching institutes and training centres that want enrollment, fee recovery, and academic reporting in one place without paying per-student SIS fees, the Education Services Dashboard in Google Sheets sits in the sweet spot.
Who Should Use This Template
Perfect for:
- Coaching institutes, training centres, and private academies with 50–5,000 active enrollments
- School and college administrators tracking fee collection against outstanding balances
- Programme coordinators comparing enrollment, attendance, and exam scores across departments and campuses
- Education consultants who present a monthly performance pack to a founder, trustee, or board
Not a fit if:
- You need a full student information system with SSO, student portals, and timetabling — PowerSchool or Anthology is the right buy
- You expect automatic payment-gateway reconciliation — this dashboard reports what you enter, it does not sync with Razorpay or Stripe
- You need row-level permissions — Google Sheets sharing is file-level, not per-student-record
- Your institution has data-residency rules that prohibit storing student data in cloud spreadsheets
Real-World Use Cases
Ravi runs a coaching institute with three campuses. Every Monday he opens the Enrollment Analysis page and compares Enrollments by Campus alongside the Course Mode Mix. After watching hybrid enrollment steadily outpace on-campus for two intakes, he moved two weekend batches fully online — a decision he made from a $9.99 spreadsheet rather than a per-student SIS licence.
Meera is the finance coordinator at a private training academy. The Revenue Analysis page shows her Collected vs Outstanding by Department, so she knows precisely which departments to chase before the quarter closes. She filters to the current term, exports the page as a PDF, and the trustee pack is done in under a minute.
Daniel is a programme director at a vocational college. He watches Avg Exam Score by Program and Monthly Avg Attendance % on the Academic Performance page, then cross-checks Student Insights for satisfaction dips. Last term he caught a struggling cohort in week six instead of at final results, and reassigned an instructor before the completion rate collapsed.
Advantages of the Education Services Dashboard in Google Sheets
It removes the reconciliation tax. When admissions, fees, and attendance live in three files, someone spends hours each month stitching them together. Here they are columns on one Data sheet, and the reconciliation is the dashboard itself.
The cost difference is not marginal. A student information system billed at $8–$15 per student per year costs a 300-student institute roughly $2,400–$4,500 in year one. This template costs $9.99 once, with no renewal and no per-user fee — and it covers the reporting layer most small institutes actually use.
Everyone can already open it. No install, no licence key, no IT ticket. Share the link, set View or Edit access, and your campus heads have the same numbers you do — on a phone if they need them.
Opportunities for Improvement
Being honest about the limits matters more than overselling. A few things this template does not do:
- No payment gateway sync. Amount Collected is a value you enter, not a figure pulled from Razorpay or Stripe. If you want live payment reconciliation, you need a proper SIS or a custom Apps Script integration.
- Performance at very large scale. Google Sheets stays responsive into the low tens of thousands of rows. A university with 50,000+ enrollment records should archive by academic year or move to a database.
- File-level security only. Anyone with edit access sees every student record. There is no built-in way to show one campus head only their own campus.
- Attendance is a percentage, not a register. The dashboard reports Attendance % per student; it does not capture daily class-by-class attendance. Pair it with a dedicated attendance entry tool if you need that granularity.
Best Practices
- Keep the column order intact. Every chart, KPI, and Search formula references the Data sheet by column. Insert new columns at the end, never in the middle.
- Update the dropdown lists first. Replace the sample Programs, Departments, Campuses, Course Modes, and Instructors with your own before pasting data, so the slicers match reality from day one.
- Enter Enrollment IDs as unique values. The Search sheet depends on them being unique. A duplicate ID returns the first match only.
- Give campus heads View access, not Edit. They get the same dashboard without the risk of someone reordering a column.
- Archive by academic year. Duplicate the file at year-end and clear the Data sheet rather than letting one file grow indefinitely.
- Update Amount Collected weekly. Collected vs Outstanding is only as useful as the day it was last refreshed.
Explore Relevant Templates
If you are building out an education reporting stack, these pair naturally with this dashboard:
- Student Academic Insights Dashboard in Google Sheets — the academic-outcomes companion, focused on grades, progress, and subject-level performance.
- Tutoring Business Dashboard in Google Sheets — built for tutors and small coaching setups tracking sessions, tutors, and revenue.
- School Admin Dashboard in Google Sheets — a broader administrative view for schools.
- Driving School Dashboard in Google Sheets — the same reporting pattern applied to driving schools.
- Google Sheets Business Pack (Pro) — 14 premium Google Sheets templates in one bundle.
💎 Running a full institute? The Education & School Management Bundle packages 8 education templates and saves 68% versus buying them individually. Prefer Microsoft’s stack? The School Admin Dashboard in Power BI is the Power BI route.
Frequently Asked Questions
What KPIs does the Education Services Dashboard in Google Sheets track?
The Education Services Dashboard in Google Sheets tracks 4 headline KPIs — Total Enrollments, Fees Collected, Avg Attendance, and Completion Rate — plus 20 supporting charts covering enrollment mix, fee recovery, grade distribution, and student satisfaction across every program and campus.
How many pages and charts are included?
The Education Services Dashboard in Google Sheets includes 7 tabs: five analysis pages (Overview, Enrollment Analysis, Revenue Analysis, Academic Performance, Student Insights) carrying 4 charts each, plus a Search sheet and a Data sheet where you paste your own records.
How does this compare to PowerSchool or Classe365?
PowerSchool and Classe365 are full student information systems billed per student per year, typically $8–$15 each with a multi-week rollout. The Education Services Dashboard in Google Sheets costs $9.99 once, sets up in under 10 minutes, and covers enrollment, fee, attendance, and grade reporting with no per-seat fees.
How long does setup take?
Setup takes under 10 minutes. Open the copy link in the PDF guide, paste your enrollment records into the Data sheet in the same column order, then refresh the dropdown lists. Every KPI card, chart, and slicer in the dashboard updates automatically from there.
Can I use it on a phone or tablet?
Yes. The Education Services Dashboard in Google Sheets runs in the free Google Sheets app on iOS and Android, and in any browser on Windows, Mac, or Chromebook. Charts and KPI cards render on mobile, although slicers are easier to drive on a desktop screen.
Do I need formulas or Apps Script knowledge to edit it?
No coding is required. The Education Services Dashboard in Google Sheets is built with standard Google Sheets formulas, charts, and native slicers. Add new programs, departments, or campuses by extending the dropdown lists and the charts pick up the new values automatically.
Can I track more than one campus?
Yes. Campus, Program, Department, Course Mode, and Instructor are all filterable dimensions. The Education Services Dashboard in Google Sheets charts Enrollments by Campus and Students by Campus directly, so multi-branch institutes can compare locations side by side.
About the Author
Built by PK — Microsoft Certified Professional with 15+ years of Excel, Google Sheets, and Power BI experience. Founder of NextGenTemplates, reaching 300K+ subscribers across YouTube channels. Every template is hand-built and tested before release.
Conclusion
If admissions, fee receipts, and attendance currently live in three different files at your institute, the Education Services Dashboard in Google Sheets collapses them into one — 4 KPIs, 20 charts, 5 analysis pages, and a 17-field student lookup, all driven by a single Data sheet. It will not replace a full student information system, and it is not trying to. It replaces the monthly reconciliation spreadsheet nobody enjoys building.
👉 Click here to Purchase the Education Services Dashboard in Google Sheets
✅ Instant download · One-time payment · No subscription · Lifetime access
🎥 For step-by-step Google Sheets tutorials, visit our YouTube channel: Youtube.com/@NeoTechNavigators
📅 Last updated: July 2026