The Professional Training and Coaching Dashboard in Google Sheets tracks 4 headline KPIs and 20 pre-built charts across 5 interactive pages, backed by a Search tab and a Data tab — 7 sheets in total. Each enrollment record captures 13 fields, and every card, chart and slicer refreshes the moment new rows land in the Data sheet. Setup takes under 10 minutes.Professional Training and Coaching Dashboard in Google Sheets
Most training and coaching businesses know their revenue. Far fewer know which trainer earns it, which program quietly loses money, or whether their best-selling category is actually their most profitable one. That gap usually persists because the answer sits in a booking spreadsheet nobody has time to pivot. This dashboard closes it: paste your enrollments once, and the analysis is already built.Professional Training and Coaching Dashboard in Google Sheets
Get the Professional Training and Coaching Dashboard in Google Sheets
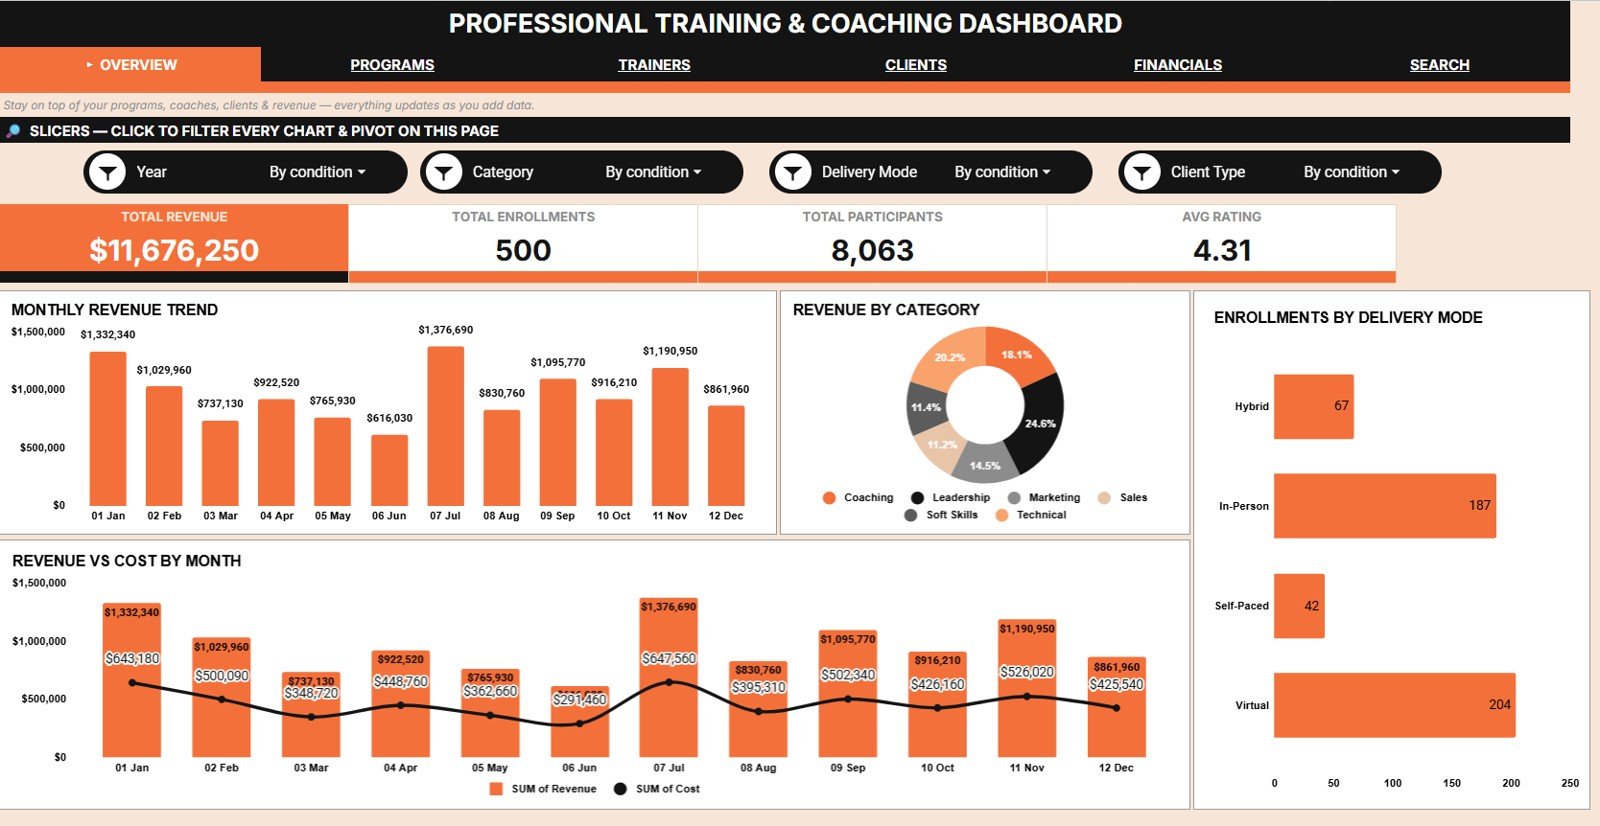 Professional Training and Coaching Dashboard in Google Sheets
Key Features of the Professional Training and Coaching Dashboard in Google Sheets
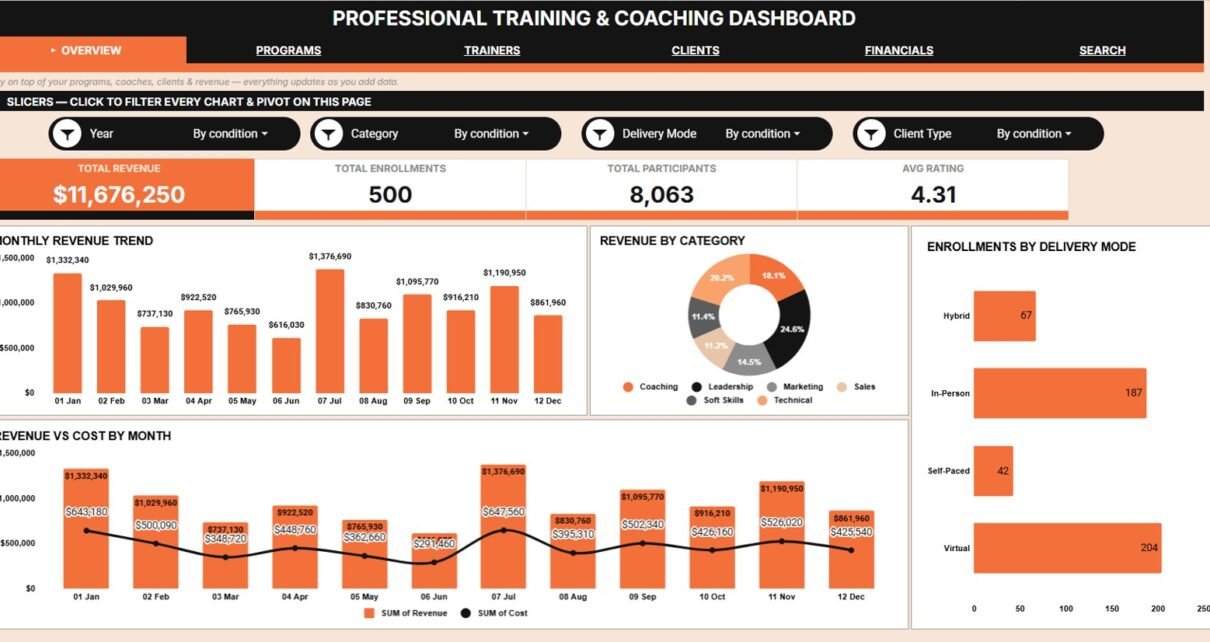
- 4 KPI cards — Total Revenue, Total Enrollments, Total Participants and Avg Rating sit at the top of the Overview page.
- 20 pre-built charts — four on each of the five analysis pages, covering revenue, cost, participants, session hours, session status and satisfaction.Professional Training and Coaching Dashboard in Google Sheets
- Native slicers on every page — filter by program, category, trainer, delivery mode, client type, region or status and every chart on that page redraws instantly.Professional Training and Coaching Dashboard in Google Sheets
- 13 fields per enrollment — Date, Program, Category, Trainer, Delivery Mode, Client Type, Region, Participants, Session Hours, Revenue, Cost, Status and Rating.Professional Training and Coaching Dashboard in Google Sheets
- A Search tab keyed by Enrollment ID — pick an ID and the full record appears, no scrolling required.
- Runs entirely in Google Sheets — no Excel licence, no install, no add-on to authorise. Share it with a link.Professional Training and Coaching Dashboard in Google Sheets
Dashboard Pages Explanation
Seven tabs: five dashboard pages, a Search tab and a Data tab. Each page carries slicers along the top and four charts beneath.Professional Training and Coaching Dashboard in Google Sheets
1. Overview Page
The Overview page opens with the four headline cards — Total Revenue, Total Enrollments, Total Participants and Avg Rating — and slicers that filter every chart below in one click. Its four charts:Professional Training and Coaching Dashboard in Google Sheets
- Revenue by Month — plots total training revenue for each month of the period. It exposes seasonality: the quarters when corporate budgets open, and the months that always run dry.Professional Training and Coaching Dashboard in Google Sheets
- Revenue by Category — splits revenue across program categories such as leadership, technical or compliance. It shows which category is carrying the business and which is merely busy.Professional Training and Coaching Dashboard in Google Sheets
- Enrollments by Delivery Mode — compares enrollment volume across online, in-person and hybrid delivery. It tells you where demand is actually moving before you commit to venue costs.
- Revenue and Cost by Month — places monthly revenue against monthly delivery cost on a single chart. The gap between the two is your margin, month by month.Professional Training and Coaching Dashboard in Google Sheets
2. Programs Analysis
This page answers a single uncomfortable question: which programs earn, and which only fill seats?Professional Training and Coaching Dashboard in Google Sheets
- Revenue by Program — ranks every program by the revenue it generated. The top of this chart is your product line; the bottom is your review list.
- Participants by Program — shows how many people each program actually trained. Read next to Revenue by Program, it exposes high-volume, low-value courses.
- Sessions by Category — counts delivered sessions in each category. It reveals where your delivery effort is concentrated, regardless of what that effort earns.Professional Training and Coaching Dashboard in Google Sheets
- Revenue by Category and Month — a month-by-month view of category revenue. It shows whether a category is growing steadily or living off one large deal.Professional Training and Coaching Dashboard in Google Sheets
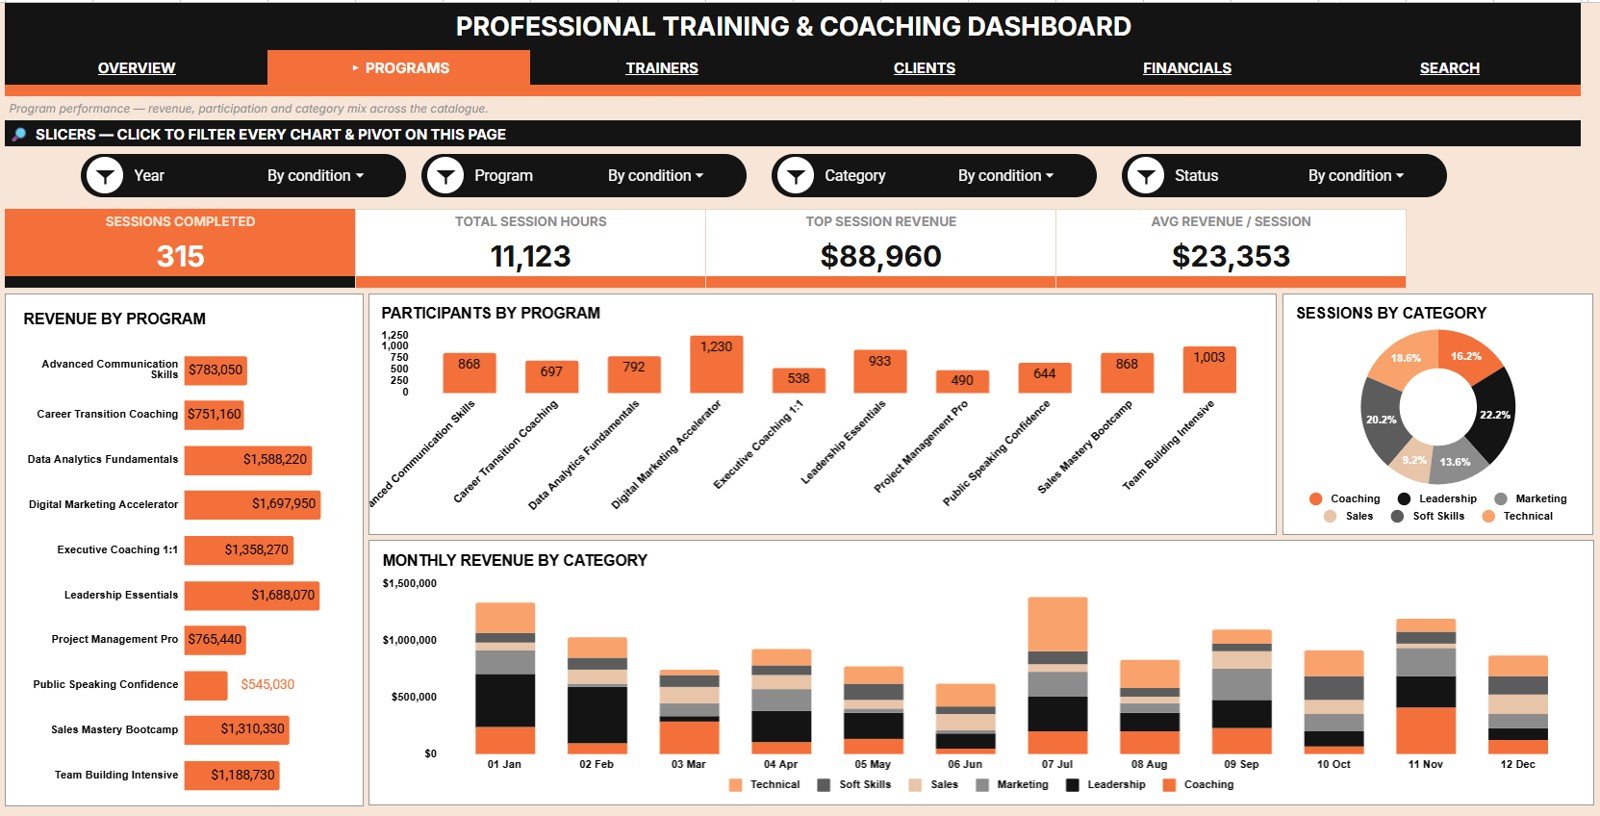 Programs Analysis
3. Trainers Analysis
Money, quality and workload for the delivery team, on one screen.
- Revenue by Trainer — attributes revenue to each trainer. It answers who is commercially productive, not simply who is busy.
- Avg Rating by Trainer — scores each trainer on participant satisfaction. Paired with Revenue by Trainer, it finds the high earner nobody wants back.
- Avg Rating by Month — tracks satisfaction over time across the whole faculty. A slow decline here is the earliest warning that delivery quality is slipping.
- Session Hours by Trainer — shows the delivery load each trainer carries. It surfaces over-booked trainers and under-used capacity at the same time.Professional Training and Coaching Dashboard in Google Sheets
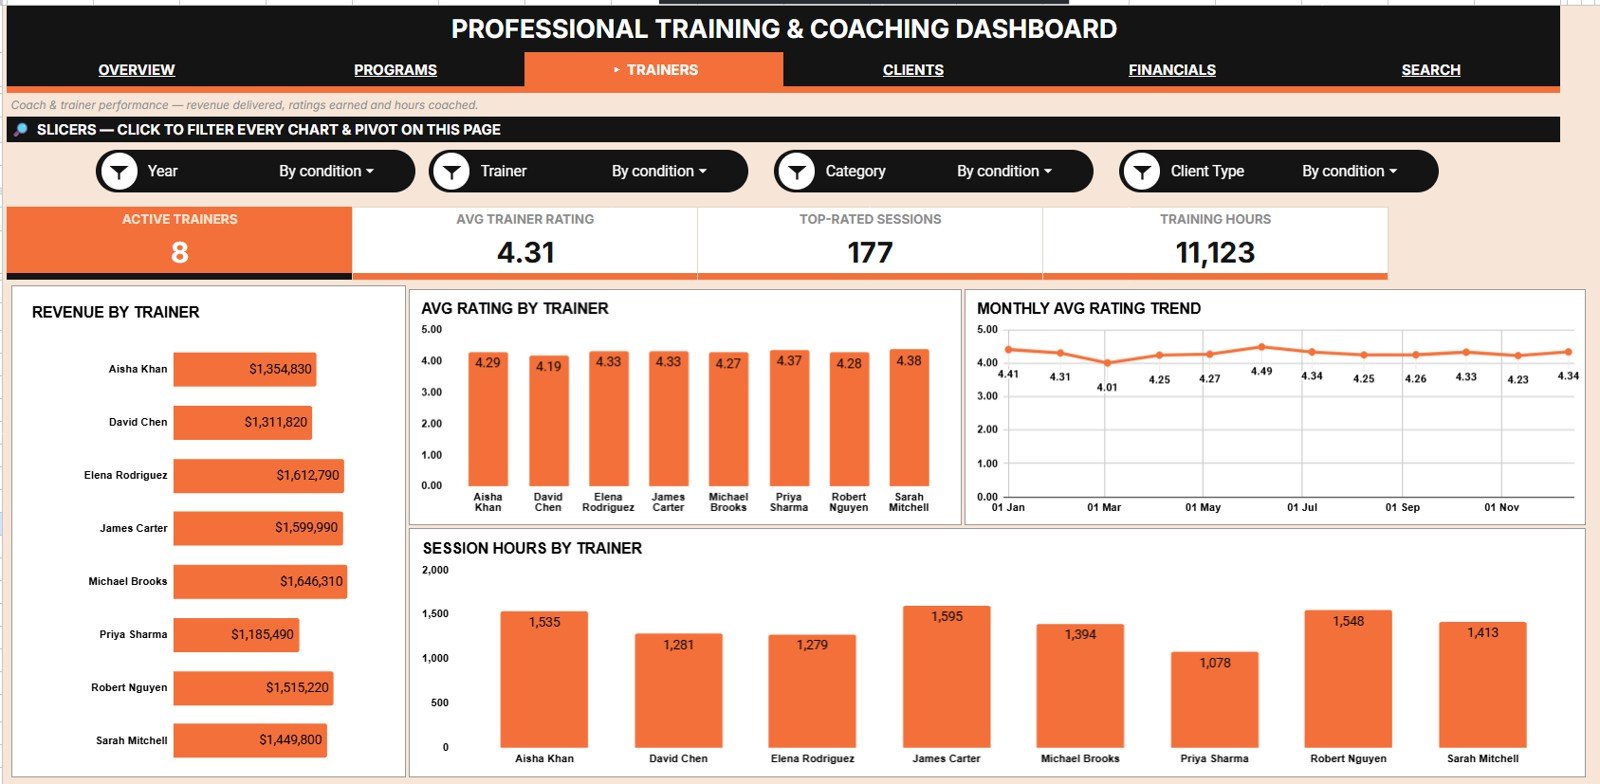 Trainers Analysis
4. Clients Analysis
Where the money comes from, by segment and by geography.
- Revenue by Client Type — compares revenue from corporate, government, individual and other client types. It shows which segment genuinely funds the business.
- Revenue by Region — maps revenue across your regions, separating territories that pay from ones that only generate enquiries.
- Participants by Region — counts trained participants per region. Read alongside Revenue by Region, it spots regions with volume but weak pricing.
- Revenue by Client Type and Month — tracks each client type month by month. It shows whether a segment is a durable channel or a one-off spike.Professional Training and Coaching Dashboard in Google Sheets
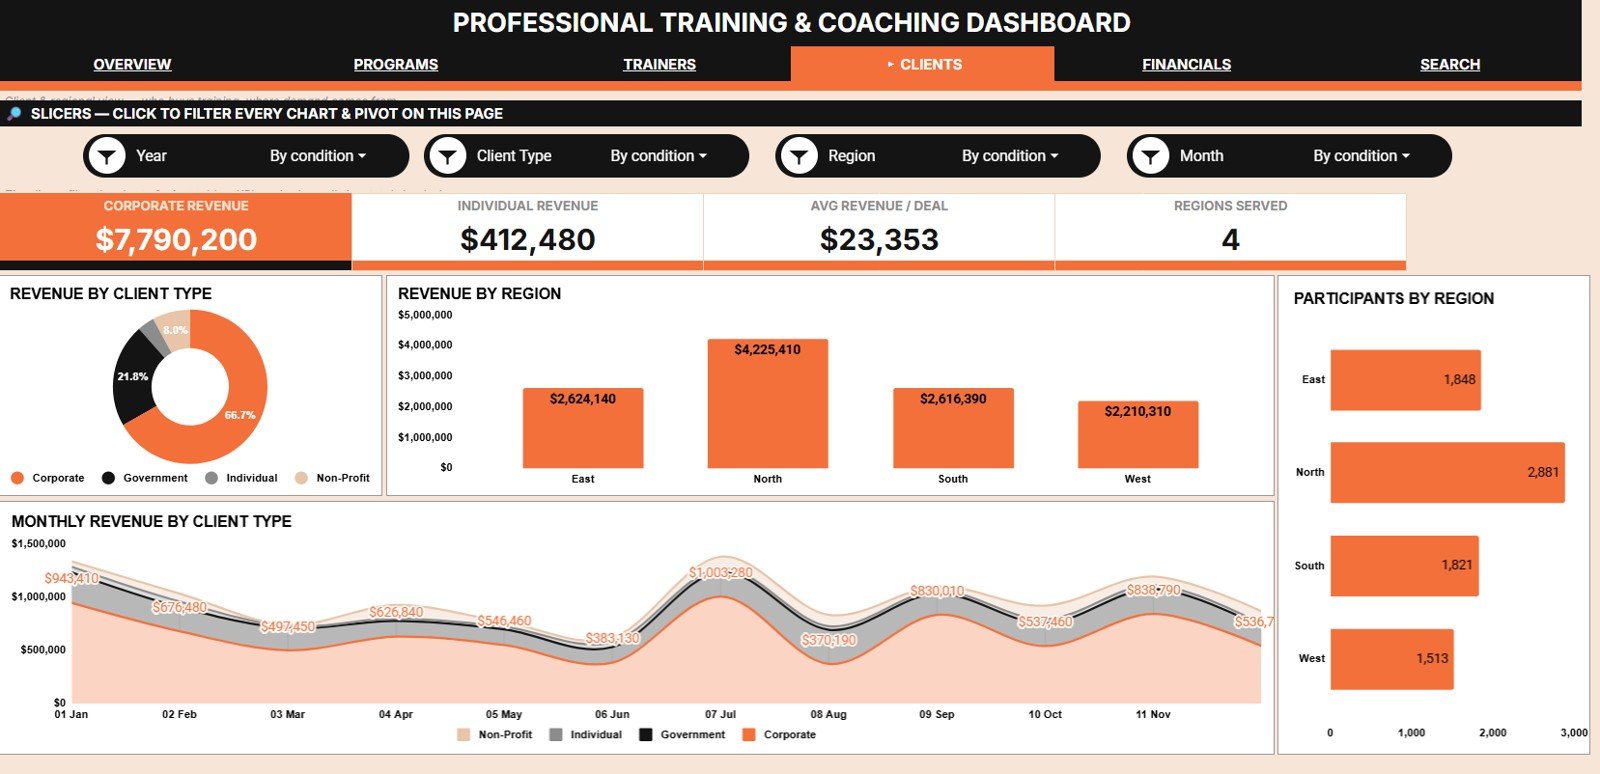 Clients Analysis
5. Financials Analysis
Money in and money out, on the same page.
- Revenue and Cost by Month — the core margin chart. A widening gap means you are scaling; a narrowing one means trouble is already here.Professional Training and Coaching Dashboard in Google Sheets
- Revenue by Month — an isolated revenue trend for clean top-line reading, without cost noise.Professional Training and Coaching Dashboard in Google Sheets
- Sessions by Status — breaks sessions into completed, scheduled, cancelled and similar states. A rising cancellation count is revenue quietly walking out.Professional Training and Coaching Dashboard in Google Sheets
- Revenue and Cost by Category — puts revenue and cost side by side for each category. This is where a popular category that loses money finally reveals itself.Professional Training and Coaching Dashboard in Google Sheets
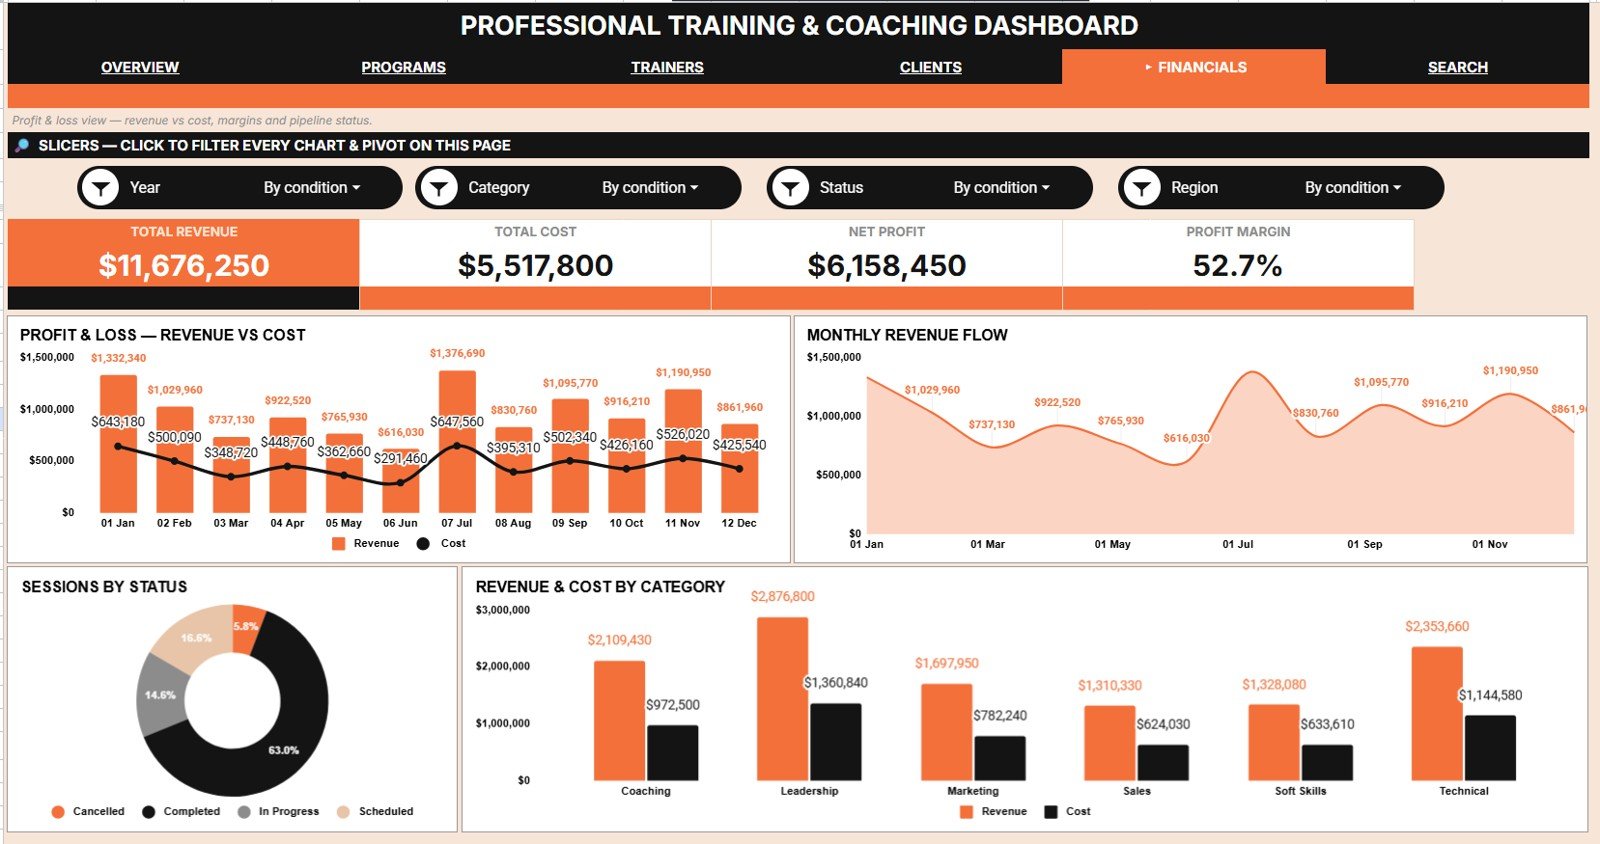 Financials Analysis
6. Search Sheet Tab
Select any Enrollment ID from the dropdown and every field of that record appears instantly — Date, Program, Category, Trainer, Delivery Mode, Client Type, Region, Participants, Session Hours, Revenue, Cost, Status and Rating. It is built for the moment a client calls about one specific booking and you do not want to scroll through 800 rows to find it.
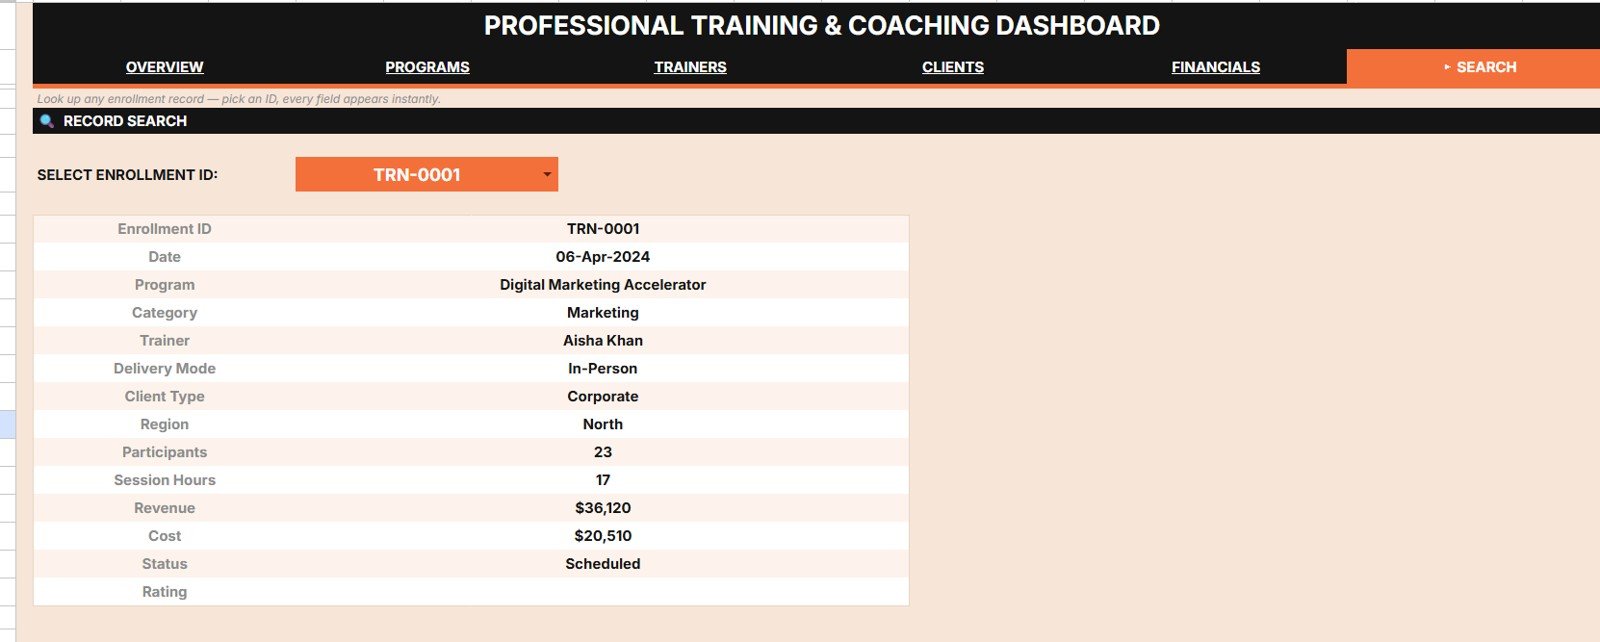 Search Sheet tab
7. Data Sheet Tab
This is the Data sheet, where every enrollment record lives. Add your data in the same 13-column format and all five dashboard pages update on their own. Keep the column order intact and the charts, cards and slicers never need touching.Professional Training and Coaching Dashboard in Google Sheets
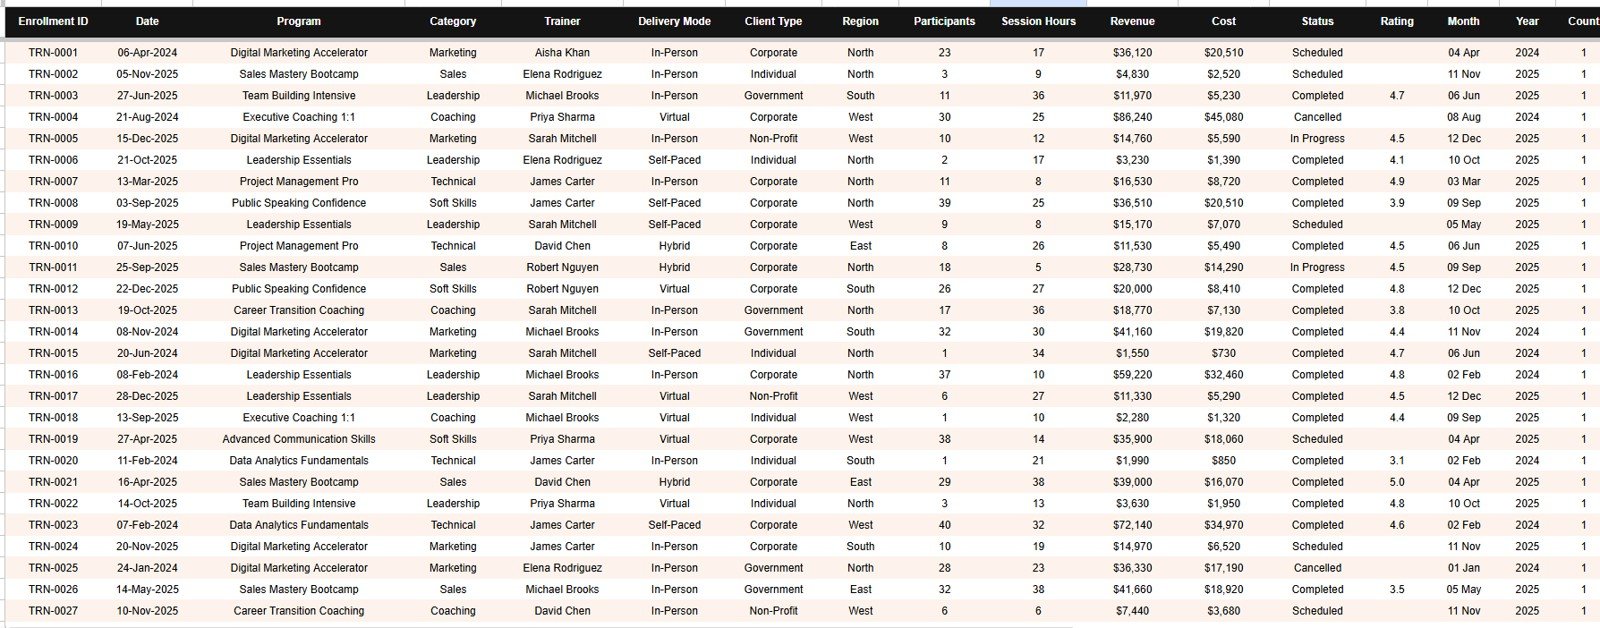 Data Sheet tab
Professional Training and Coaching Dashboard vs. Excel vs. Paid Training SaaS — Feature Comparison
| Feature | Professional Training and Coaching Dashboard (Google Sheets) | Excel Training Dashboard | Training SaaS (Arlo / TalentLMS / Accessplanit) |
|---|---|---|---|
| Cost | $9.99 one-time ✅ | $10–20 one-time + Microsoft 365 licence | $100–$500+ / month, typically per seat |
| Platform | Google Sheets — any browser, any device ✅ | Excel desktop (licence required) | Vendor cloud platform |
| Setup time | Under 10 minutes ✅ | 10–20 minutes | Weeks of onboarding and configuration |
| Real-time team collaboration | Built in — native Sheets sharing ✅ | Partial — needs OneDrive / M365 | Yes ✅ (on paid seats) |
| Mobile access | Free Google Sheets app ✅ | Limited on mobile Excel | Yes ✅ (on paid seats) |
| Add your own programs, trainers, regions | Edit any dropdown list — no code ✅ | Yes ✅ | Often restricted to vendor-defined fields |
| Share with a link | One link, unlimited viewers ✅ | File attachment or OneDrive link | Yes ✅ (licensed users only) |
| Trainer profitability view (revenue + rating + hours) | Dedicated Trainers Analysis page ✅ | Varies by template | Usually a reporting add-on or higher tier |
| Year-1 cost for a 5-person team | $9.99 total ✅ | $10–20 + five Microsoft 365 licences | $1,200–$6,000+ |
For training and coaching businesses that want program-level and trainer-level profitability without a four-figure annual platform contract, the Professional Training and Coaching Dashboard sits in the sweet spot.
Who Should Use This Template
Perfect for:
- Corporate training providers and L&D consultancies delivering 5–500 programs a year
- Independent coaches and coaching practices tracking enrollments, session hours and repeat clientsProfessional Training and Coaching Dashboard in Google Sheets
- Training managers who need revenue, utilisation and satisfaction per trainer in one view
- Skill academies and certification bodies billing per participant across several regionsProfessional Training and Coaching Dashboard in Google Sheets
Not a fit if:
- You need learner logins, course hosting or SCORM delivery — that is an LMS, and this is a reporting dashboard
- You want invoicing, payment collection or a CRM pipeline inside the same file
- Your organisation requires SOC 2, SSO or audited access controls on reporting data
- You expect enrollments to sync automatically from a booking system with no manual paste
Real-World Use Cases
Priya runs a corporate training firm with nine freelance trainers. She compares Revenue by Trainer against Avg Rating by Trainer on the Trainers Analysis page and found that her second-highest earner had the lowest satisfaction score. She reassigned him off the account before the client raised it — a renewal saved by one chart.
Marcus is an executive coach running a small practice. Revenue by Client Type and Revenue by Region showed him that corporate clients produced roughly three times the revenue per session of individual clients, while consuming similar hours. He restructured his pricing and stopped chasing individual bookings.
Elena manages L&D delivery for a manufacturing group. She uses Revenue and Cost by Category to identify compliance programs running at a loss, then applies the region slicer to check whether the problem is one plant or the whole group. Before this, cost sat in a different spreadsheet entirely.Professional Training and Coaching Dashboard in Google Sheets
Advantages of the Professional Training and Coaching Dashboard
- Cost. A one-time $9.99 purchase against $1,200–$6,000 a year for a comparable reporting tier on a training platform.
- Time. Setup runs under 10 minutes because the 20 charts, 4 cards and every slicer already exist. You are not building, you are pasting.
- Margin visibility. Revenue and cost appear on the same chart on two separate pages, so an unprofitable program cannot hide behind a healthy top line.
- Ownership. The file lives in your Google Drive. No vendor holds your data, and nothing expires when you stop paying.
- Zero licensing friction. Google Sheets is free with any Google account, so the whole team can view the same live numbers at no extra cost.
Opportunities for Improvement
It is worth being honest about the boundaries of this template. It is a reporting layer, not an operations platform.
- Data entry is manual. Enrollments are pasted or typed into the Data sheet. There is no automatic sync from a booking or payment system.
- No forecasting. Every chart is historical. The dashboard tells you what happened, not what next quarter will look like.
- It is not an LMS. There is no content hosting, no assessments, no learner login — and it does not pretend otherwise.
- Very large datasets slow down. Google Sheets handles thousands of rows comfortably, but a business logging tens of thousands of enrollments a year will eventually want a database.
Best Practices
- Log cost at the same time as revenue. Half the value of this dashboard sits in the cost column. Leave it blank and you have a revenue report, not a margin report.
- Keep dropdown lists short and consistent. “Online” and “On-line” become two separate slicer values and split your charts in half.
- Capture Rating on every session. A single missing rating skews Avg Rating by Trainer far more than people expect.
- Review Sessions by Status monthly. Cancellations are the leading indicator that shows up before the revenue chart notices.
- Duplicate the file per financial year. Keeps the sheet fast and makes year-on-year comparison a straight swap between two tabs. Google’s own Sheets Help Center covers version history if you want to roll back instead.
Explore Relevant Templates
- Coach Performance and Revenue Dashboard in Google Sheets — the individual-coach view; read the full walkthrough here.
- Consulting Performance Dashboard in Google Sheets — the same client-and-margin logic applied to consulting engagements (blog post).
- Student Academic Insights Dashboard in Google Sheets — learner outcomes rather than business revenue (blog post).
- Business Development Performance Dashboard in Google Sheets — track the pipeline that fills your training calendar.
- 💎 Save 48% — get this and 13 more templates in the Google Sheets Business Pack (Pro) (what’s included).
Want to build dashboards like this yourself? The Excel Pivot Tables & Dashboards course on NextGenTemplates Academy walks through the reporting skills step by step, with practice files.
Get the Professional Training and Coaching Dashboard in Google Sheets
Frequently Asked Questions
What KPIs does the Professional Training and Coaching Dashboard track?
The Professional Training and Coaching Dashboard tracks four headline KPIs — Total Revenue, Total Enrollments, Total Participants and Avg Rating — plus 20 charts covering revenue, cost, session hours, session status, participants and satisfaction by program, trainer, client type and region.
How long does setup take?
Setup takes under 10 minutes. Copy the sheet to your Google Drive, paste your enrollment records into the Data tab using the same 13 columns, and update the dropdown lists. Every card, chart and slicer in the Professional Training and Coaching Dashboard then recalculates automatically.
How does this compare to a paid training platform like TalentLMS or Arlo?
Training platforms bill monthly and exist to deliver courses. The Professional Training and Coaching Dashboard is a one-time $9.99 purchase built to report on the business — revenue, cost, trainer performance and client mix. Plenty of training firms run both, using each for what it is good at.
Can I add my own programs, trainers and regions?
Yes. Every dropdown in the Professional Training and Coaching Dashboard reads from an editable list. Add programs, categories, trainers, delivery modes, client types or regions and the slicers and charts pick them up without any formula changes.
Do I need Excel or any paid software?
No. The Professional Training and Coaching Dashboard runs entirely in Google Sheets, which is free with any Google account. There is no Excel licence, no install and no add-on to authorise. It works in any modern browser, on desktop or mobile.
Can my whole team view the dashboard at the same time?
Yes. Because the Professional Training and Coaching Dashboard lives in Google Sheets, you share a single link and everyone sees the same live numbers. There are no per-user fees, and viewers do not need to buy anything themselves.
Is this an LMS — can I deliver courses through it?
No, and that is deliberate. The Professional Training and Coaching Dashboard is a reporting and analysis tool, not a learning management system. It will not host content, run assessments or log learners in. It tells you how the training business is actually performing.
About the Author
Built by PK — Microsoft Certified Professional with 15+ years of Excel, Google Sheets, and Power BI experience. Founder of NextGenTemplates, reaching 300K+ subscribers across YouTube channels. Every template is hand-built and tested before release.
Conclusion
A training and coaching business does not usually fail because it cannot count revenue. It fails because nobody noticed which program was subsidising the others, or which trainer was earning well while quietly costing the firm its next renewal. The Professional Training and Coaching Dashboard in Google Sheets puts those answers on five pages that build themselves the moment you paste your data in.
✅ Instant download · One-time payment · No subscription
📅 Last updated: July 2026