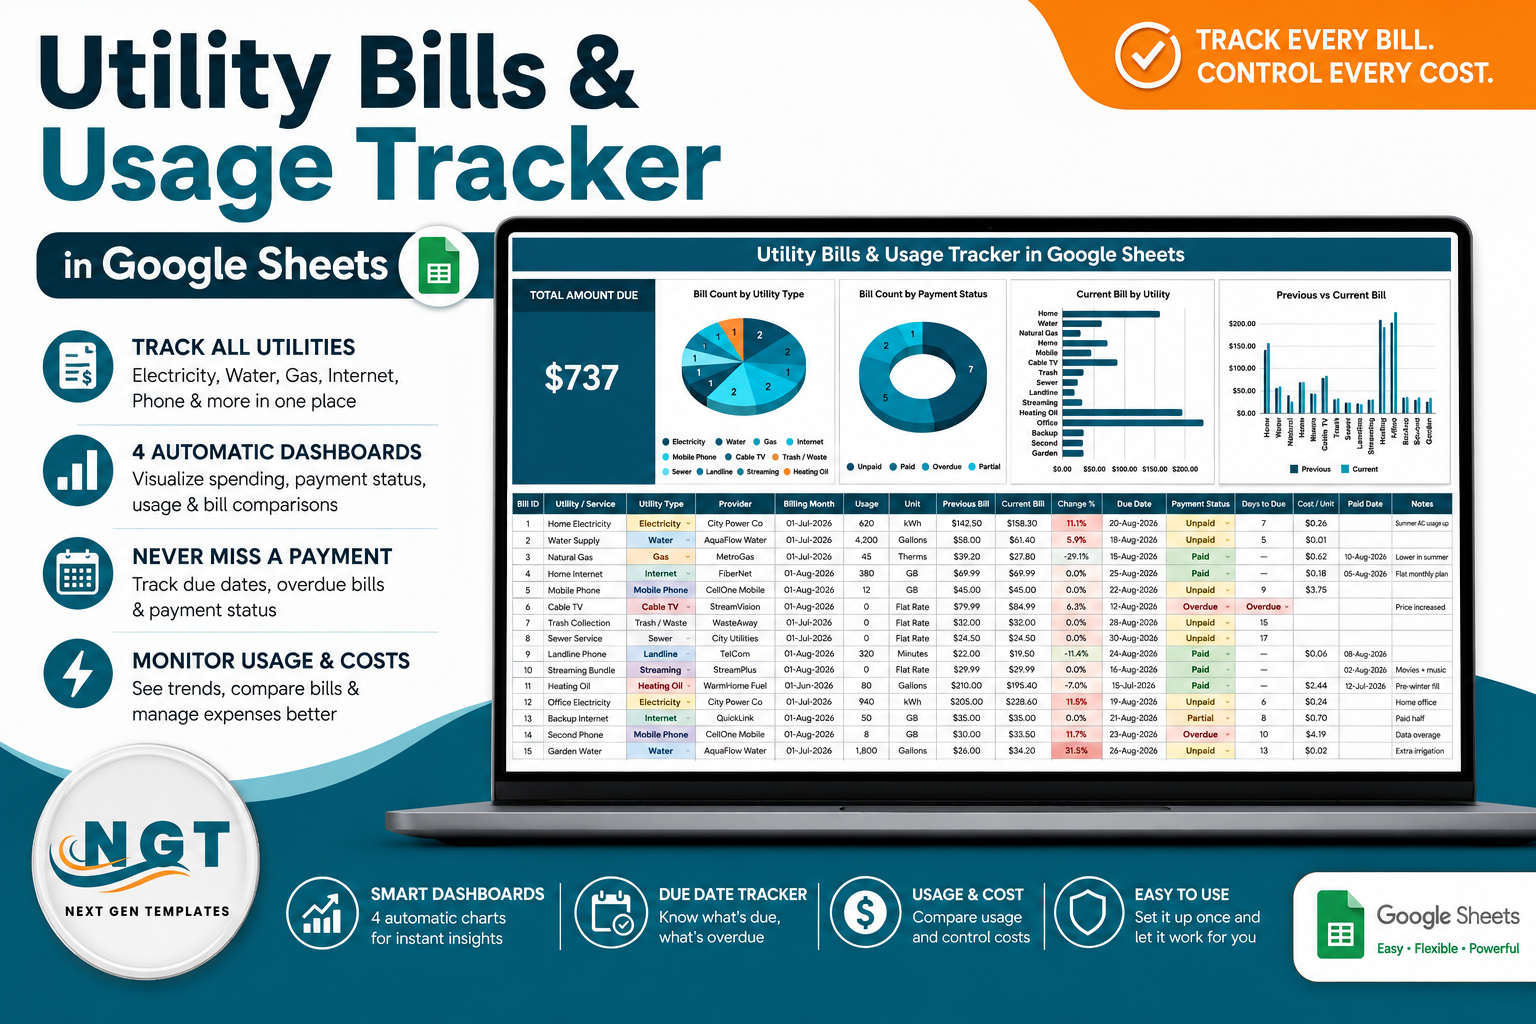
The average household pays 6 to 12 recurring utility bills a month, each with its own provider, billing cycle and due date. The Utility Bills & Usage Tracker in Google Sheets puts all of them on one page: 11 utility types, 16 data columns per bill, 4 automatic charts and a single Total Amount Due card that shows exactly what you owe right now. Four of those columns — Bill ID, Change %, Days to Due and Cost / Unit — calculate themselves.
Most people track bills in one of two broken ways: a bank app that shows the money but not the usage, or a paper pile that shows neither until something is overdue. Neither tells you that your water bill rose 31.5% or that you are actually paying $0.26 per kWh. This tracker does both, in a Google Sheet you can open on any browser or phone, share by link, and own outright for a one-time $6.99.
Get the Utility Bills & Usage Tracker in Google Sheets
Key Features of the Utility Bills & Usage Tracker in Google Sheets
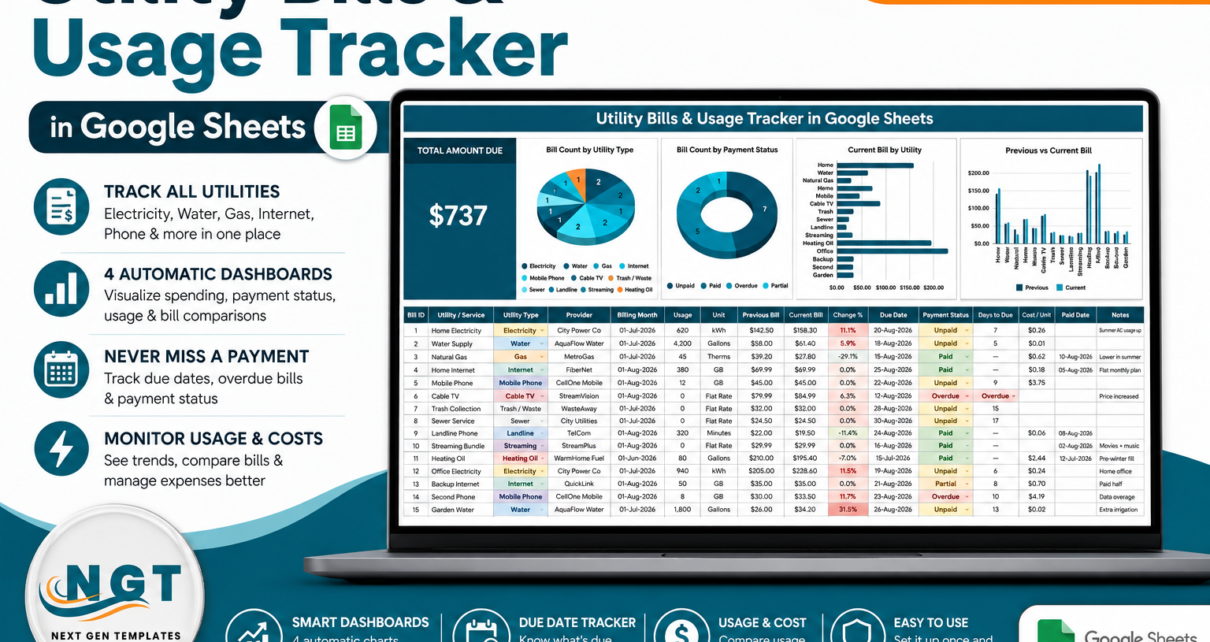
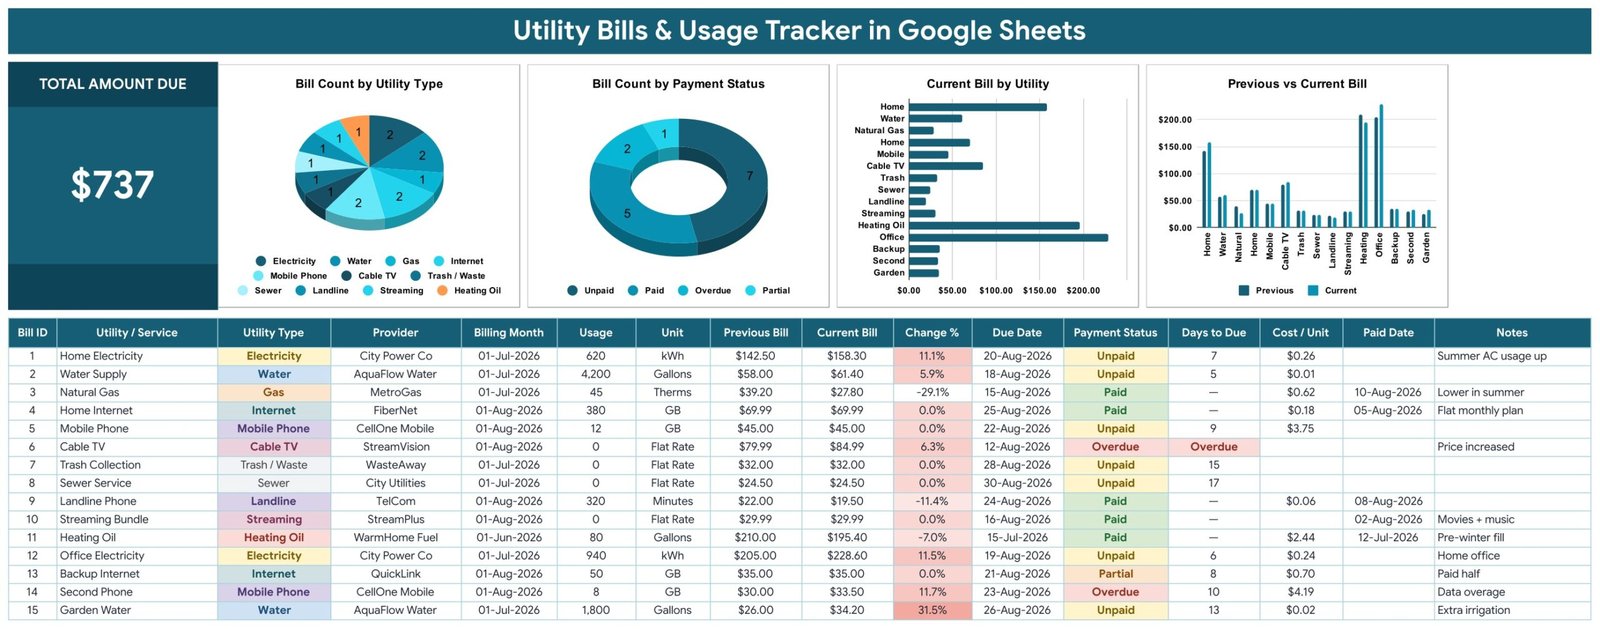
- Total Amount Due card. One large KPI card sums the Current Bill of every row whose Payment Status is not “Paid”. In the sample data that is $737 across 15 bills. Change one status and the number moves immediately.
- 11 utility types out of the box. Electricity, Water, Gas, Internet, Mobile Phone, Cable TV, Trash / Waste, Sewer, Landline, Streaming and Heating Oil — each colour-coded in the table so the sheet reads at a glance.
- Four payment statuses. Unpaid, Paid, Overdue and Partial. A half-paid internet bill does not get lumped in with one you have not touched.
- Days to Due countdown. Counts down from today’s date and flips to a red “Overdue” label the moment a bill passes its due date. Once you mark it Paid the countdown collapses to a dash.
- Change % against the previous bill. Shaded red on a rise and green on a fall, so a 31.5% garden-water jump or a 29.1% summer gas drop is visible without doing any maths.
- Cost / Unit. Divides the Current Bill by the Usage figure to give you a real rate — $0.26 per kWh, $0.01 per gallon, $0.18 per GB — which is the only number worth comparing between providers.
- Auto-expanding dropdowns. Utility Type, Provider, Unit and Payment Status validate against a List tab across rows 2-500. Add a value there and it appears in every row’s dropdown instantly.
- Charts that grow with you. All four charts read the data columns directly across rows 16-1000 using the built-in Aggregate option, so there are no hidden helper tables to break.
Template Structure — Sheet by Sheet
The tracker is deliberately a one-pager. The dashboard sits on top and the data sits directly underneath, so you never scroll between a chart and the row that feeds it. Three visible tabs plus a hidden List tab handle everything.
Sheet 1: Tracker Dashboard and Bills Table
The Total Amount Due card anchors the left, and four charts run across the top: Bill Count by Utility Type, Bill Count by Payment Status, Current Bill by Utility, and Previous vs Current Bill. Below them sits the 16-column entry table — Bill ID, Utility / Service, Utility Type, Provider, Billing Month, Usage, Unit, Previous Bill, Current Bill, Change %, Due Date, Payment Status, Days to Due, Cost / Unit, Paid Date and Notes — pre-loaded with 15 realistic sample rows you overwrite with your own.
Sheet 2: How to Use
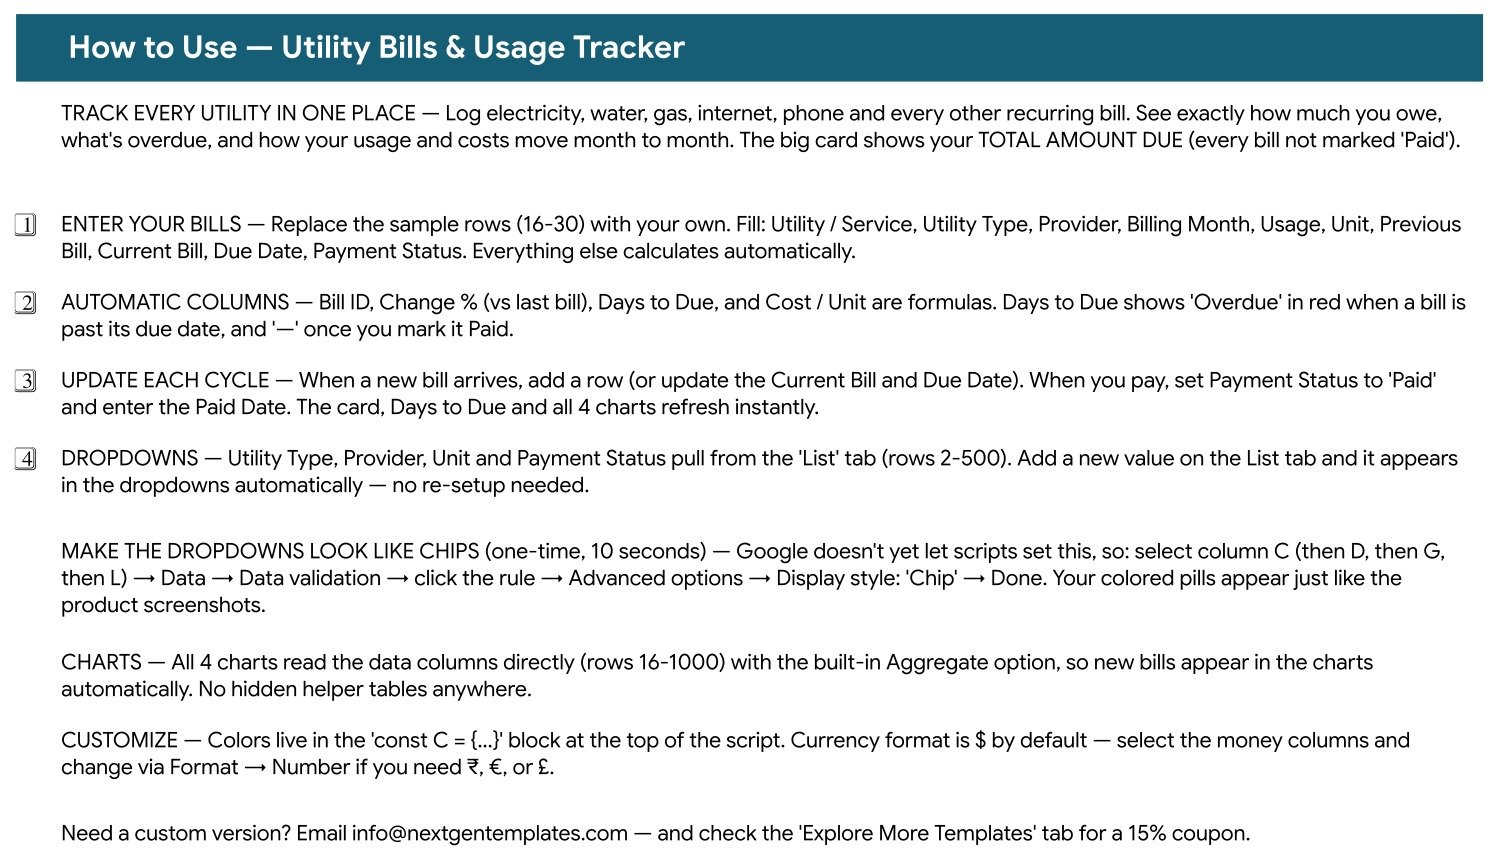
An instruction sheet built into the file. It walks through the four setup steps, names which columns are formulas and must not be typed over, explains how to switch dropdowns to Google’s coloured “Chip” display style, and shows where the colour palette and currency format live if you want to rebrand or switch to ₹, € or £.
Sheet 3: Explore More Templates
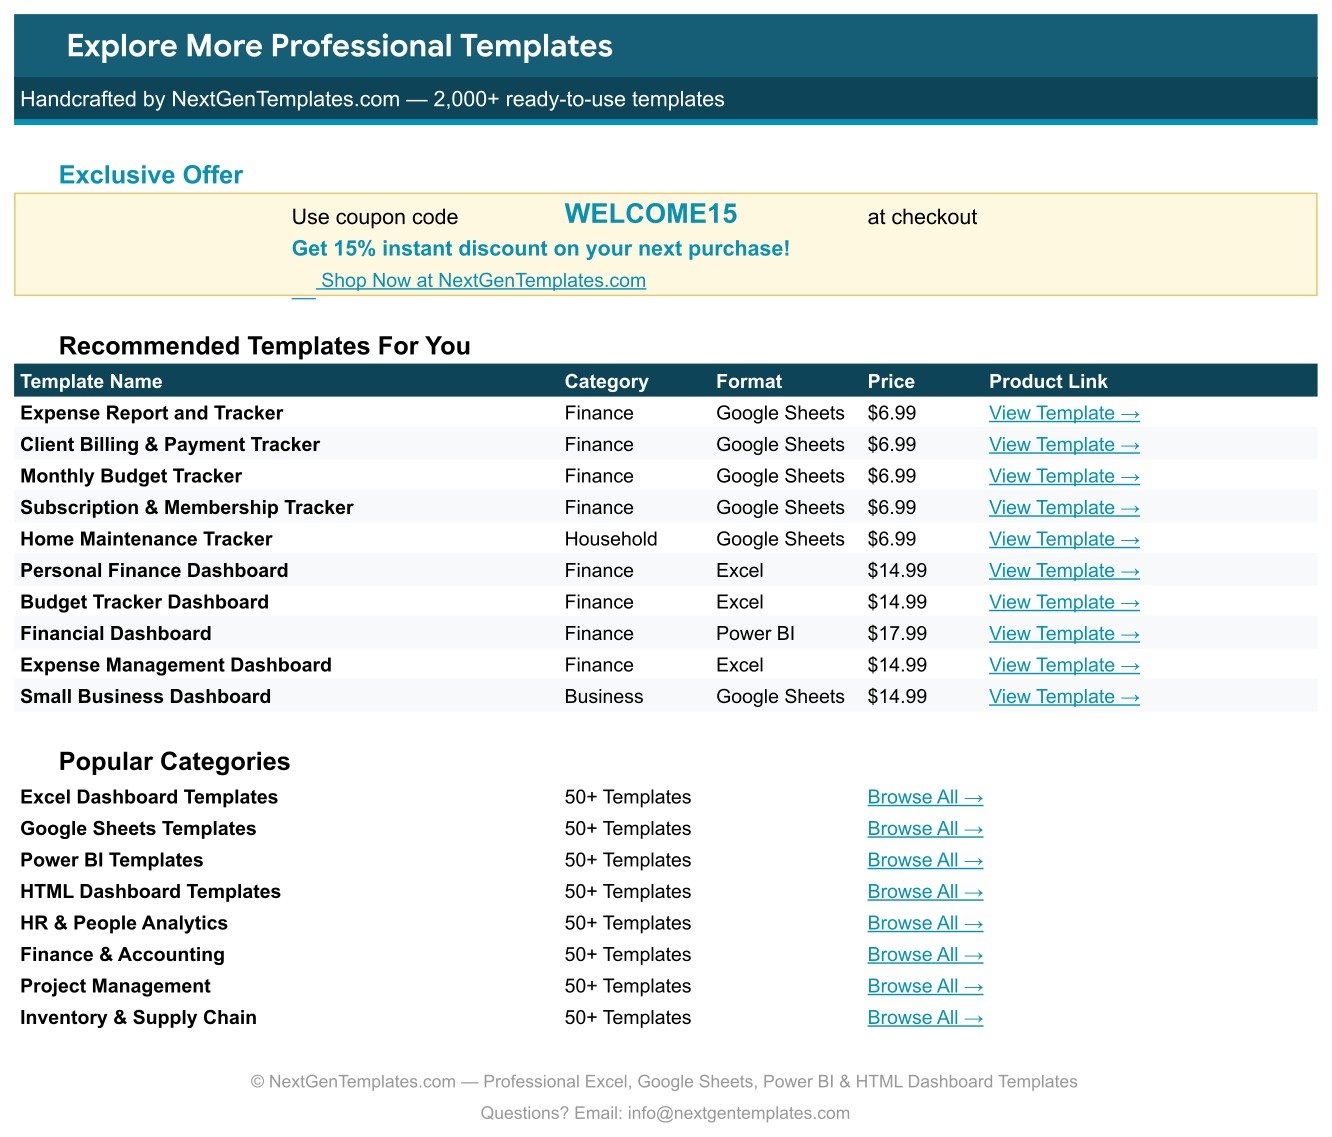
A curated index of related NextGenTemplates trackers and dashboards with live product links, popular category shortcuts, and a WELCOME15 coupon good for 15% off a future purchase.
Utility Bills & Usage Tracker vs. Microsoft Excel Dashboard vs. Rocket Money / YNAB — Feature Comparison
| Feature | Utility Bills & Usage Tracker | Microsoft Excel Dashboard | Rocket Money / YNAB / Quicken |
|---|---|---|---|
| Cost | $6.99 one-time | $10-20 one-time + Office licence | $6-15 / month, forever |
| Platform | Any browser, free Google account ✅ | Microsoft Excel required | Vendor app only |
| Setup time | Under 10 minutes ✅ | 15-20 minutes | 30+ min plus bank linking |
| Bank login required | Never — you type the bills ✅ | No | Yes, credentials shared |
| Usage tracking (kWh, gallons, GB) | Built in with Cost / Unit ✅ | Possible, manual formulas | Rarely supported |
| Real-time collaboration | Native, share by link ✅ | Only via OneDrive | Extra seat fees |
| Customisable utility types | Unlimited via List tab ✅ | Editable | Fixed vendor categories |
| Mobile access | Free Sheets app ✅ | Limited on mobile Excel | Yes |
| Year-1 cost at 5 users | $6.99 total ✅ | $10-20 + licences | $360-900 |
For households and small offices that want a clear picture of what they owe without handing bank credentials to an app or paying monthly forever, the Utility Bills & Usage Tracker sits in the sweet spot.
Who Should Use This Template
Perfect for:
- Households juggling 6-20 recurring bills across several providers and due dates
- Remote workers and freelancers splitting home-office utilities for tax or reimbursement
- Landlords and property managers tracking utilities across a handful of units
- Small offices, clinics and studios paying their own electricity, water and internet
- Anyone who wants the usage data — kWh, gallons, GB — next to the money, not just the money
Not a fit if:
- You want bills imported automatically. This is a manual-entry tracker by design — which is precisely why it never asks for bank access.
- You are a utility company analysing thousands of customer meters. That is a Power BI job, not a spreadsheet one.
- You need approval workflows, audit trails or invoice attachments. A dedicated accounts-payable system will serve you better.
Real-World Use Cases
Maria runs a three-bedroom household with a partner who travels. She logs electricity, water, gas, internet, two mobile plans and a streaming bundle, shares the sheet with her partner by link, and checks the Total Amount Due card every Sunday evening. When the Change % column flagged an 11.1% electricity rise, she traced it to summer air-conditioning rather than a tariff change — and adjusted the thermostat instead of calling the provider.
Dev is a freelance developer who claims part of his home as an office. He keeps office electricity and backup internet on their own rows, tagged in the Notes column. At tax time he filters the table and produces a defensible utility figure in under a minute, with the Cost / Unit column evidencing the rate he actually paid rather than an estimate.
Priya manages four small rental units. Provider and Billing Month are her grouping fields, the Days to Due countdown keeps tenant-billed utilities out of late-fee territory, and the Previous vs Current Bill chart is what caught the unit whose water usage doubled overnight. A leak, found in a chart rather than a plumber’s invoice.
Advantages of the Utility Bills & Usage Tracker
It costs once. $6.99 against $72-180 a year for a budgeting subscription. Over three years that is the difference between a coffee and a car service.
It never sees your bank. Nothing in this tracker requires provider logins or open-banking consent. You type the numbers off the bill, which takes about 90 seconds a month and keeps your credentials entirely your own.
It tracks usage, not just spend. This is the genuine gap in most consumer finance apps. Knowing you paid $158.30 tells you nothing; knowing you used 620 kWh at $0.26 each tells you whether to change behaviour or change supplier. Regulators such as the U.S. Energy Information Administration publish average rates you can benchmark your Cost / Unit against directly.
It is genuinely collaborative. Google Sheets sharing means a partner, housemate or office manager can update a row from their phone and everyone sees it instantly — no seat licences, no export-and-email.
Opportunities for Improvement
Honesty helps more than hype. Three things this tracker does not do:
- No automatic import. Every bill is typed in. For 10 bills a month that is fine; for 200 across a property portfolio it would not be.
- No multi-year trend page. The charts compare Previous versus Current bill, not a rolling 24-month history. If you want long-run seasonality you will need to duplicate the sheet per year or move to a full dashboard build.
- Chip-style dropdowns need one manual step. Google Apps Script cannot yet set the “Chip” display style, so the coloured pills in the screenshots require a 10-second manual toggle per column via Google Sheets data validation settings. The How to Use sheet spells it out.
Best Practices
- Enter the bill the day it arrives, not the day it is due. The Days to Due countdown is only useful if the row exists before the deadline.
- Always fill Usage and Unit, even when the bill is a flat rate — leave Usage at 0 and the Cost / Unit column stays clean rather than showing a misleading rate.
- Use Notes as your audit trail. “Summer AC usage up”, “price increased”, “home office” — six months later those three words explain a spike you would otherwise re-investigate.
- Extend the List tab first, not the dropdown. Adding a provider on the List tab propagates everywhere; editing one cell’s validation does not.
- Review Change % monthly, not annually. A 6% creep caught in month one is a phone call; caught in month twelve it is a year of overpayment.
Explore Relevant Templates
Utilities are one slice of the monthly outflow. These pair naturally with it:
- Bill Payment Tracker in Google Sheets — for the non-utility bills: insurance, loans, memberships.
- Subscription and Membership Tracker in Google Sheets — catches the recurring charges that quietly renew.
- Personal Cash Flow Tracker in Google Sheets — shows how all of it lands against income.
- Bank Account Balance Tracker in Google Sheets — keeps multiple accounts reconciled in one view.
- Home Renovation Budget Tracker in Google Sheets — for homeowners planning bigger work.
Related reading on this blog: the Annual Family Budget Tracker in Google Sheets, the Holiday & Christmas Budget Tracker in Google Sheets, and the Gym Membership Tracker in Google Sheets.
💎 Buying more than one? The Tracker Toolkit — 12 Premium Templates bundles a dozen trackers for far less than the sum of their parts.
Want to build skills like this step by step? The NextGenTemplates Academy learning paths cover the spreadsheet fundamentals behind trackers like this one, with practice files.
Get the Utility Bills & Usage Tracker in Google Sheets
Frequently Asked Questions
What does the Utility Bills & Usage Tracker in Google Sheets track?
The Utility Bills & Usage Tracker records 16 fields per bill across 11 utility types and calculates Total Amount Due, Change % versus the previous bill, Days to Due and Cost / Unit automatically. Four charts summarise bill counts, payment status and current versus previous spend.
How long does setup take?
Under 10 minutes. Copy the sheet from the link in the PDF, overwrite the 15 sample rows with your own bills, and the Utility Bills & Usage Tracker dashboard rebuilds itself. The optional chip-style dropdown formatting adds roughly 10 seconds per column.
Do I need to connect a bank account?
No. The Utility Bills & Usage Tracker never requests bank or provider credentials — you enter the amounts from the bill yourself. That is the deliberate trade-off against apps like Rocket Money: a minute of typing in exchange for zero credential sharing and no monthly fee.
How does this compare to YNAB or Quicken?
YNAB and Quicken cost $6-15 per month and budget your entire financial life. The Utility Bills & Usage Tracker costs $6.99 once, focuses only on recurring utilities, and adds what they mostly omit: usage in kWh, gallons, therms or GB with a calculated cost per unit.
Can I add utility types or providers of my own?
Yes. Every dropdown in the Utility Bills & Usage Tracker reads the List tab across rows 2-500. Type a new utility type, provider or unit there and it appears in the dropdown on every row immediately, with no formula editing and no re-setup.
Will bills I add later show up in the charts?
Yes. All four charts read the data columns directly across rows 16-1000 with the built-in Aggregate option, so new rows appear in the Utility Bills & Usage Tracker charts automatically. There are no hidden helper tables to extend.
Can I use a currency other than dollars?
Yes. Select the money columns in the Utility Bills & Usage Tracker and use Format > Number to switch to ₹, €, £ or any other currency. The colour theme is equally editable from the palette block at the top of the script.
About the Author
Built by PK — Microsoft Certified Professional with 15+ years of Excel, Google Sheets, and Power BI experience. Founder of NextGenTemplates, reaching 300K+ subscribers across YouTube channels. Every template is hand-built and tested before release.
Conclusion
Utility bills are the most predictable expense most people fail to look at. The Utility Bills & Usage Tracker in Google Sheets makes them visible: one card for what you owe, one countdown for what is due, one percentage for what changed, and one rate for what you are actually paying per unit. Ten minutes of setup, then about 90 seconds a month.
Instant download · One-time payment · No subscription
Last updated: August 2026