In today’s fast-paced interior design industry, staying on top of key performance indicators (KPIs) is crucial for success. Whether you’re tracking project costs, timelines, or client satisfaction, a well-structured dashboard can be a game-changer. This is where the Interior Design KPI Dashboard in Google Sheets comes in. It is a powerful tool that allows you to monitor and analyze critical data in real-time, making it easier to assess performance, adjust strategies, and optimize workflows.
In this guide, we will explore the features, advantages, opportunities for improvement, and best practices for using the Interior Design KPI Dashboard in Google Sheets. We will also provide insights into how to set it up and make the most out of it.
What is the Interior Design KPI Dashboard in Google Sheets?
The Interior Design KPI Dashboard in Google Sheets is a customizable, ready-to-use template designed to help interior design firms track and manage their projects’ performance. It includes various KPIs that are essential for the success of any interior design project, such as budget tracking, project completion rates, and client feedback.
This dashboard is built entirely within Google Sheets, meaning it’s easy to use and accessible to anyone with an internet connection. It allows for seamless collaboration and data entry across teams and departments. Let’s dive into the key features that make this dashboard an invaluable tool for interior designers.
Key Features of the Interior Design KPI Dashboard
The Interior Design KPI Dashboard in Google Sheets includes several essential features, spread across six different worksheets:
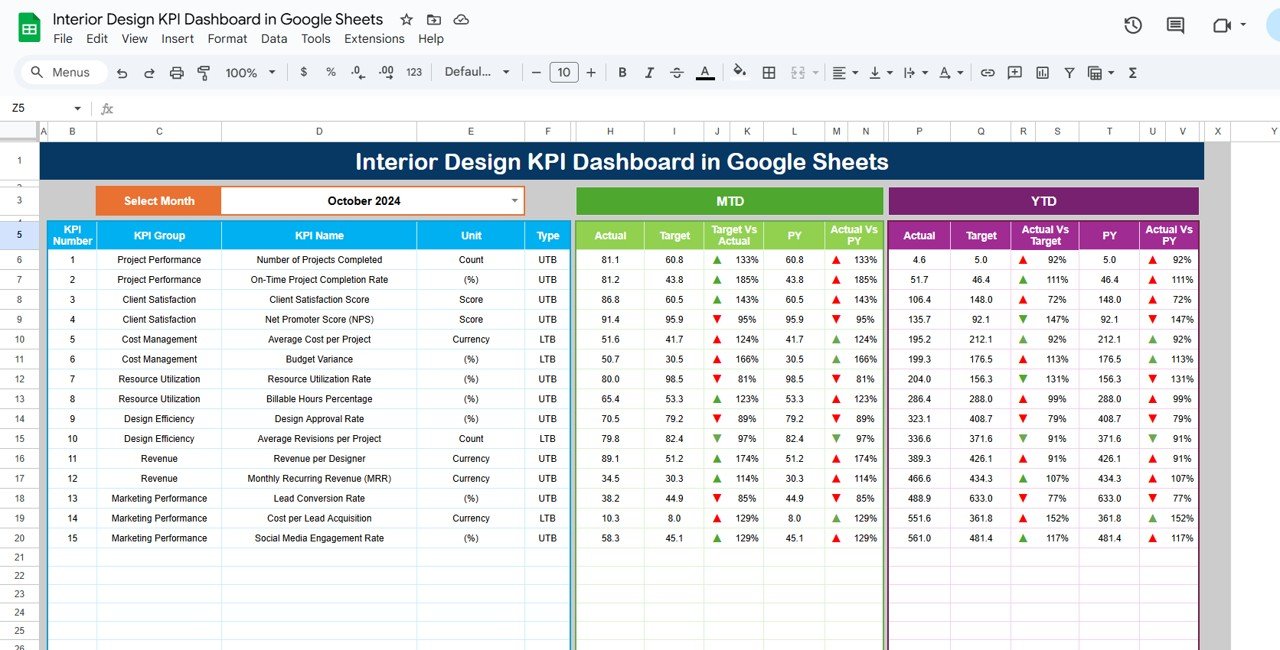
1. Dashboard Sheet Tab
The main sheet displays all the important KPIs for your design projects. You can select a specific month using a dropdown menu (located at range D3), and the entire dashboard will update accordingly. Here, you can track:
-
MTD (Month-To-Date) Actual, Target, and Previous Year data
-
Year-to-Date (YTD) Actual, Target, and Previous Year data
-
Conditional formatting with up and down arrows to quickly assess the differences between actual and target values.
Click to buy Interior Design KPI Dashboard in Google Sheets
2. KPI Trend Sheet Tab
This sheet allows you to select the KPI name from a dropdown menu (range C3). The following information is displayed:
-
KPI Group
-
Unit of measurement
-
KPI Type (whether ‘Lower the Better’ or ‘Upper the Better’)
-
Formula used to calculate the KPI
-
A concise definition of the KPI

Click to buy Interior Design KPI Dashboard in Google Sheets
3. Actual Numbers Sheet Tab
This tab is used to input actual values for MTD and YTD performance for each month. You can change the month by updating the first month of the year in range E1. This allows for an easy comparison of performance over time.

Click to buy Interior Design KPI Dashboard in Google Sheets
4. Target Sheet Tab
Here, you can input target numbers for each KPI, both MTD and YTD. This provides a baseline to compare against the actual performance.

Click to buy Interior Design KPI Dashboard in Google Sheets
5. Previous Year Numbers Sheet Tab
This sheet is where you enter the actual numbers from the previous year for comparison purposes. It enables year-over-year analysis and helps assess trends over time.

6. KPI Definition Sheet Tab
This sheet provides detailed information about each KPI, including:
-
KPI Name
-
KPI Group
-
Unit
-
Formula
-
Definition
This makes it easy for users to understand the calculation method and significance of each KPI.

Click to buy Interior Design KPI Dashboard in Google Sheets
Advantages of the Interior Design KPI Dashboard in Google Sheets
- Real-Time Data Tracking: The dashboard allows for real-time tracking of KPIs, enabling immediate access to updated data. This ensures that your decisions are always based on the most current information available.
- Customizable for Different Needs: You can adjust the dashboard according to your specific requirements. Whether you are a small design firm or a large agency, the KPIs and data can be tailored to suit your operations.
- Comprehensive Overview: The dashboard provides a clear, at-a-glance view of your KPIs, showing both monthly and year-to-date performance. It also compares current performance against previous years, helping to spot trends and anomalies quickly.
- User-Friendly Interface; The interface is intuitive, with dropdown menus for KPI selection and month adjustment. Even those with minimal experience in data management can easily navigate and use the dashboard.
- Collaboration Made Easy; Since the dashboard is hosted on Google Sheets, it supports real-time collaboration. Multiple team members can access and update the data simultaneously, ensuring seamless teamwork.
- Cost-Effective Solution: Being a Google Sheets template, it requires no additional software, making it an affordable solution for small to medium-sized design firms.
Opportunities for Improvement in the Interior Design KPI Dashboard
Click to buy Interior Design KPI Dashboard in Google Sheets
- Integration with Other Tools: Currently, the dashboard relies on manual data entry. Integrating it with other software like project management or accounting tools could automate data entry, saving time and reducing the risk of errors.
- Automation of Data Entry; By using Google Apps Script or other automation tools, the data entry process could be automated, ensuring more accurate and faster updates without manual intervention.
- . Enhanced Visualizations: The dashboard could include more advanced visualizations, such as heat maps, trend lines, or pie charts, to provide deeper insights into the data and improve decision-making.
- Expansion of KPIs: While the dashboard tracks key performance metrics, adding more KPIs related to customer satisfaction, design quality, or resource utilization could give a more holistic view of project performance.
- Mobile Optimization: While Google Sheets is accessible on mobile, optimizing the dashboard for better use on smaller screens could improve accessibility for teams working remotely or on-site.
- User Access Control: Introducing different access levels (e.g., view-only or edit permissions) would help enhance security and ensure that only authorized users can modify the dashboard.
Best Practices for Using the Interior Design KPI Dashboard
Click to buy Interior Design KPI Dashboard in Google Sheets
- Regular Data UpdatesEnsure that you update the dashboard regularly (at least monthly) to keep the data accurate and relevant. This will help you track progress and make informed decisions in a timely manner.
- Provide Clear Data Entry Guidelines: Clearly define how to enter data for both actuals and targets to avoid errors. Use data validation or dropdown lists where possible to streamline the process.
- Leverage Conditional Formatting: Make full use of the conditional formatting features to highlight important trends. Color-coded arrows, for instance, can quickly show whether your KPIs are on track or need attention.
- Maintain Consistency: Ensure consistency in data entry, especially when it comes to calculating KPIs. Always use the same method for calculating metrics to maintain accuracy and reliability.
- Customize KPIs for Your Business; Adapt the KPI definitions, units, and formulas to align with your specific business needs. Customizing the template will ensure it remains relevant and effective.
- Review the Dashboard Regularly: Set a routine to review the dashboard with your team, especially during project milestones or at the end of each month. This will give you a chance to assess performance and make necessary adjustments.
- Gather Feedback from Users: Solicit feedback from users to improve the dashboard’s functionality. Understand how they use the tool and make changes that could enhance their experience and data analysis.
Conclusion
The Interior Design KPI Dashboard in Google Sheets is an invaluable tool for interior design firms looking to streamline project tracking and decision-making. It helps you monitor essential KPIs in real-time, compare performance over time, and make data-driven decisions that drive success. By following the best practices, capitalizing on opportunities for improvement, and leveraging its advantages, you can enhance the efficiency and effectiveness of your design operations.
Frequently Asked Questions (FAQs)
Click to buy Interior Design KPI Dashboard in Google Sheets
1. How do I update the data in the Interior Design KPI Dashboard?
You can update the data by entering the actual numbers for MTD, YTD, and previous year data in the respective sheets. Simply input the data for each month and the dashboard will update automatically.
2. Can I use this dashboard for multiple projects?
Yes, the dashboard is customizable, so you can adapt it for multiple projects by adding separate sheets or adjusting the KPIs according to each project’s requirements.
3. Can I share the dashboard with my team?
Absolutely! Since the dashboard is built in Google Sheets, you can easily share it with your team by providing them with access via email. You can also set different access permissions to control who can edit or view the dashboard.
4. Is it possible to integrate this dashboard with other tools like project management software?
Currently, the dashboard doesn’t have integration with other tools, but you can manually update it with data from other platforms. You can also explore using Google Apps Script for automation and integrations.
5. How can I ensure the data entered is accurate?
To ensure accuracy, it’s important to set clear guidelines for data entry. You can also use data validation tools in Google Sheets to limit incorrect inputs and ensure that only valid data is entered.
Visit our YouTube channel to learn step-by-step video tutorials
Youtube.com/@NeotechNavigators
Watch the step-by-step video Demo: