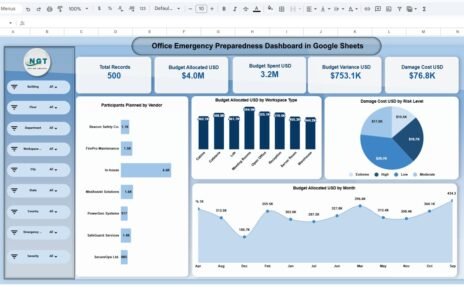
Managing IT assets efficiently is critical for cost control, risk management, and operational efficiency. From laptops and servers to software licenses and networking devices, keeping track of all assets can be complex — but with the IT Asset Management Dashboard in Google Sheets, you can simplify everything.IT Asset Management Dashboard in Google Sheets
This ready-to-use dashboard provides complete visibility into your IT assets, their status, cost, depreciation, and net book value (NBV) — all in one interactive view.IT Asset Management Dashboard in Google Sheets
What Is an IT Asset Management Dashboard in Google Sheets?
An IT Asset Management Dashboard is a visual reporting tool that helps you monitor the lifecycle of IT assets — from purchase to depreciation.
Built in Google Sheets, it consolidates information such as total asset count, cost, net book value, warranty status, and vendor details. You can filter data, visualize trends, and make quick data-driven decisions.
This solution eliminates manual tracking errors and provides real-time insights into the organization’s hardware and software portfolio.
Dashboard Structure Overview
Click to Buy IT Asset Management Dashboard in Google Sheets
The dashboard includes multiple interactive sheets, each offering a specific perspective on IT asset data:
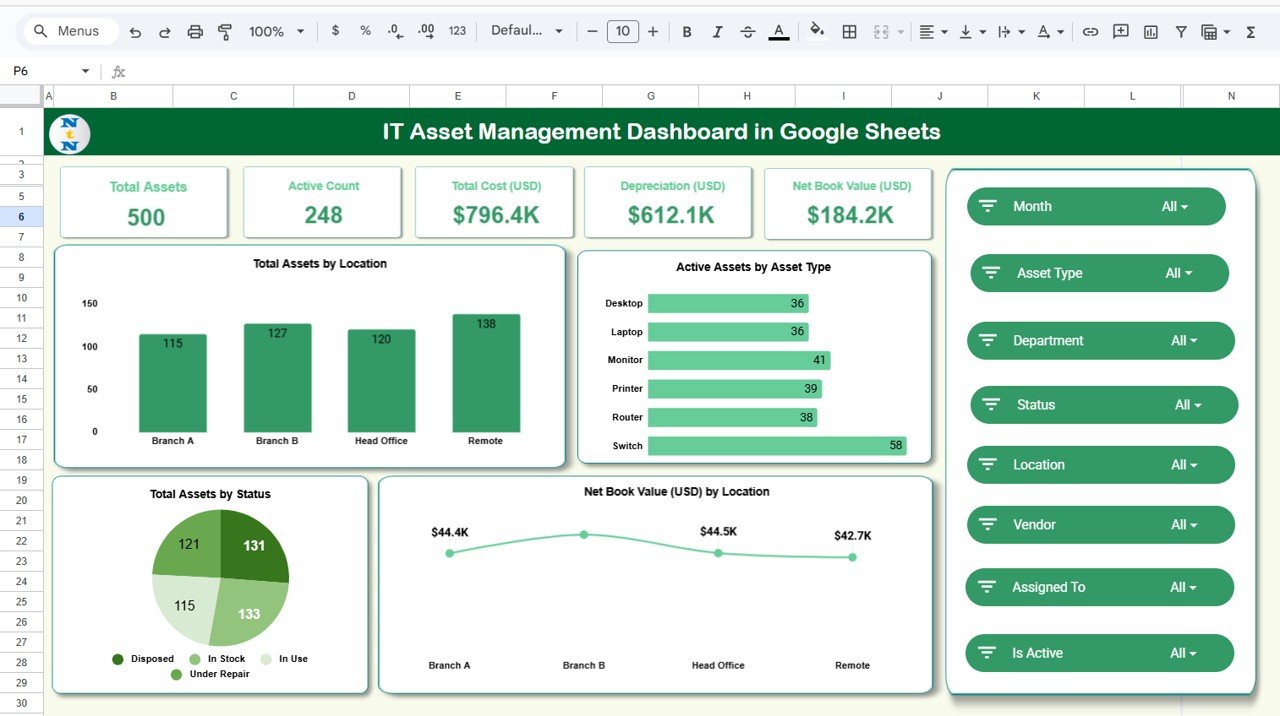
1. Overview Sheet Tab
The Overview Sheet gives a high-level summary of the company’s IT asset portfolio through key cards and charts.
KPI Cards
-
Total Assets – Total count of IT assets recorded.
-
Active Count – Number of assets currently in use.
-
Total Cost (USD) – Combined purchase cost of all assets.
-
Depreciation (USD) – Cumulative depreciation value for all assets.
-
Net Book Value (USD) – The current total value after depreciation.
These KPIs instantly summarize the financial and operational health of your IT infrastructure.
Charts in the Overview Sheet
-
Active Assets by Asset Type – Visualizes how active assets are distributed (e.g., Laptops, Desktops, Servers).
-
Total Assets by Location – Shows asset allocation across offices or branches.
-
Net Book Value (USD) by Location – Displays location-wise asset valuation after depreciation.
-
Total Assets by Status – Differentiates between Active, Inactive, Under Repair, or Disposed assets.
These charts help in quick identification of asset distribution and value concentration across the organization.
Click to Buy IT Asset Management Dashboard in Google Sheets
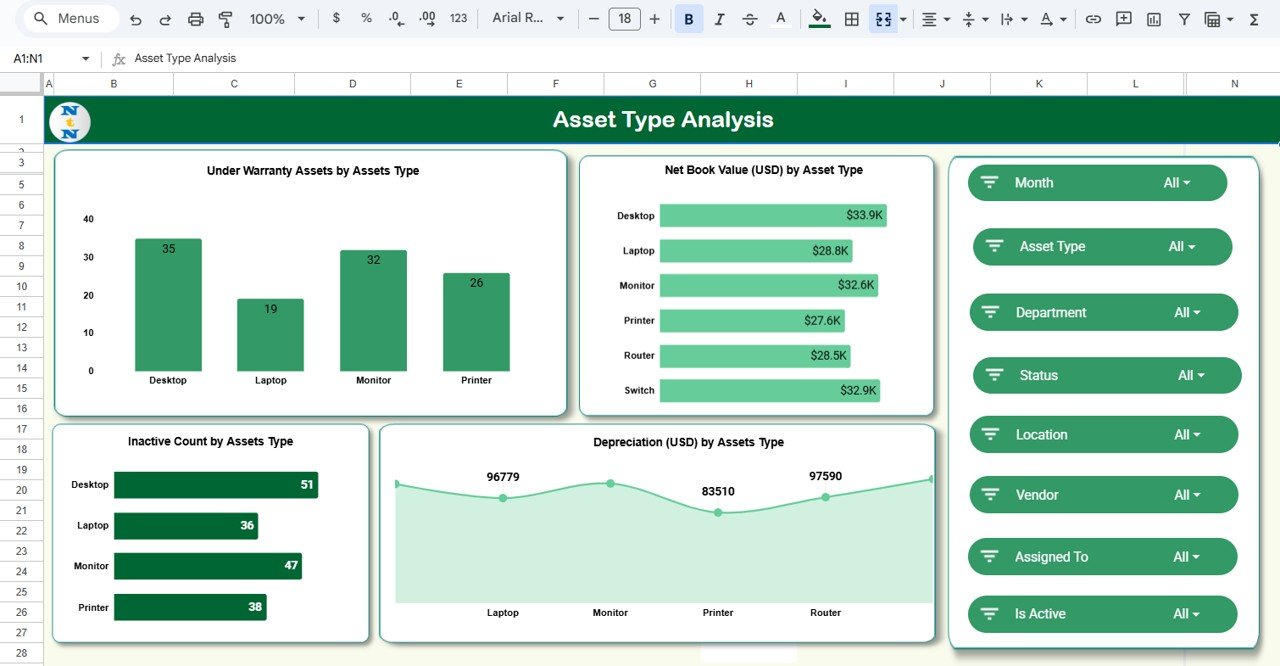
2. Asset Type Analysis Sheet
This sheet focuses on analyzing IT assets by their type (e.g., Laptop, Server, Printer, Router, etc.).
Charts Included
-
Under Warranty Assets by Asset Type – Shows how many assets of each type are still under warranty.
-
Net Book Value (USD) by Asset Type – Displays the valuation of different asset categories.
-
Depreciation (USD) by Asset Type – Helps understand depreciation impact across asset types.
-
Inactive Count by Asset Type – Identifies how many devices are no longer in use.
This view helps procurement and IT teams plan replacements and optimize asset utilization.
Click to Buy IT Asset Management Dashboard in Google Sheets
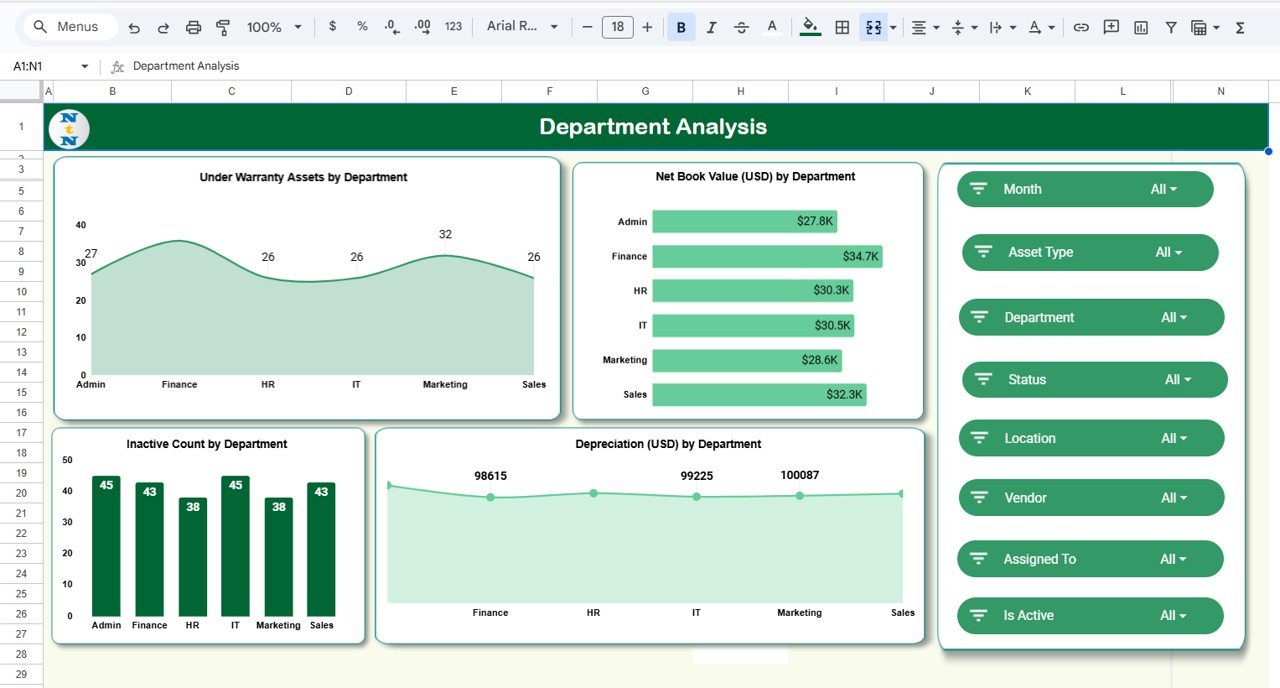
3. Department Analysis Sheet
The Department Analysis tab provides department-wise asset distribution and performance.
Charts Included
-
Under Warranty Assets by Department – Displays department assets still covered under warranty.
-
Net Book Value (USD) by Department – Highlights the total current asset value per department.
-
Depreciation (USD) by Department – Tracks how department assets depreciate over time.
-
Inactive Count by Department – Identifies departments with idle or obsolete assets.
This data helps department heads and finance teams make better budgeting decisions.
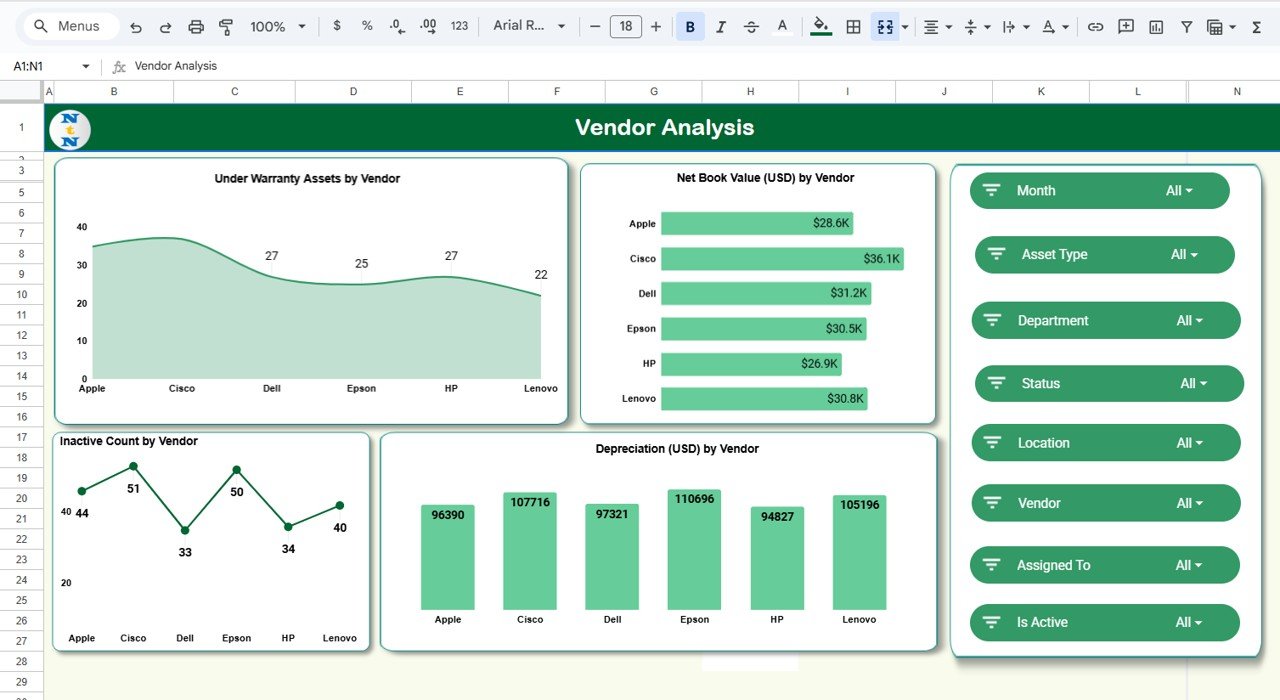
4. Vendor Analysis Sheet
Vendor management is crucial for maintaining service quality and tracking warranties.
Charts Included
-
Under Warranty Assets by Vendor – Helps monitor vendor warranty commitments.
-
Net Book Value (USD) by Vendor – Evaluates vendor contribution in terms of current asset value.
-
Depreciation (USD) by Vendor – Tracks asset value reduction per vendor-supplied product.
-
Inactive Count by Vendor – Identifies vendors whose supplied assets often become inactive early.
This view ensures accountability and supports vendor performance evaluation.
Click to Buy IT Asset Management Dashboard in Google Sheets
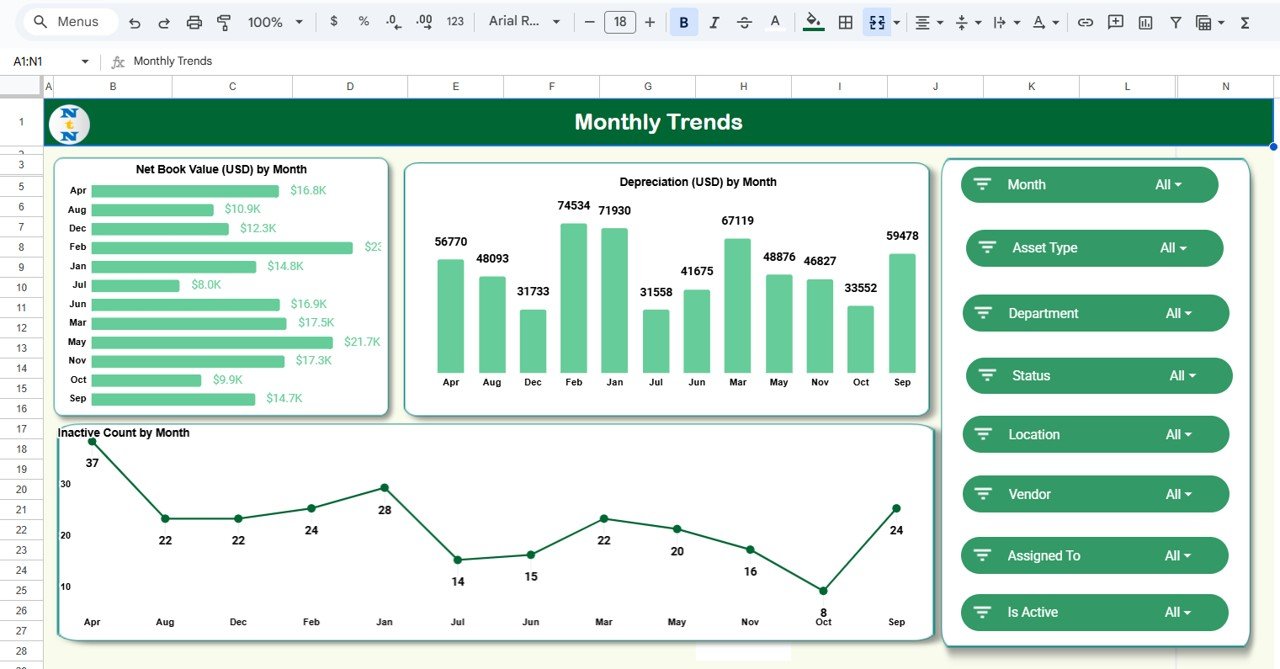
5. Monthly Trends Sheet
The Monthly Trends Sheet tracks the evolution of IT assets over time.
Charts Included
-
Net Book Value (USD) by Month – Shows how total asset value changes monthly.
-
Depreciation (USD) by Month – Tracks monthly depreciation impact.
-
Inactive Count by Month – Displays how many assets became inactive over time.
This helps forecast capital expenditure and plan timely asset replacements.
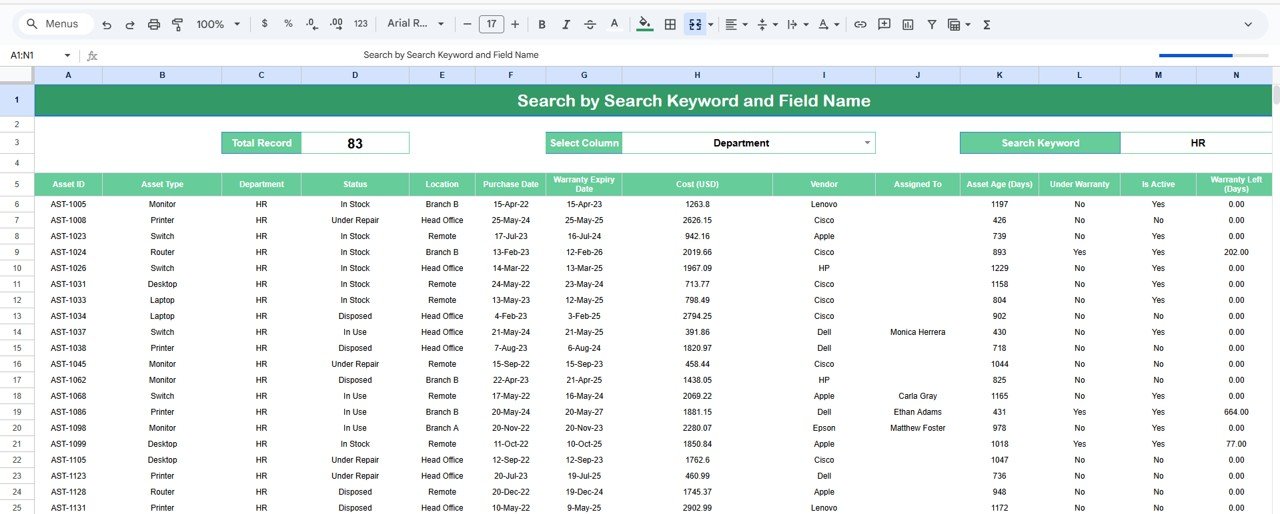
6. Search Tab
The Search Sheet Tab makes it easy to find assets based on specific criteria.
You can search by keyword or field name — for example:
-
Search “Laptop” to find all laptop assets.
-
Search “Vendor ABC” to view vendor-specific data.
-
Search “Warranty” to filter under-warranty items.
This feature ensures quick access to asset details in large databases.
Click to Buy IT Asset Management Dashboard in Google Sheets
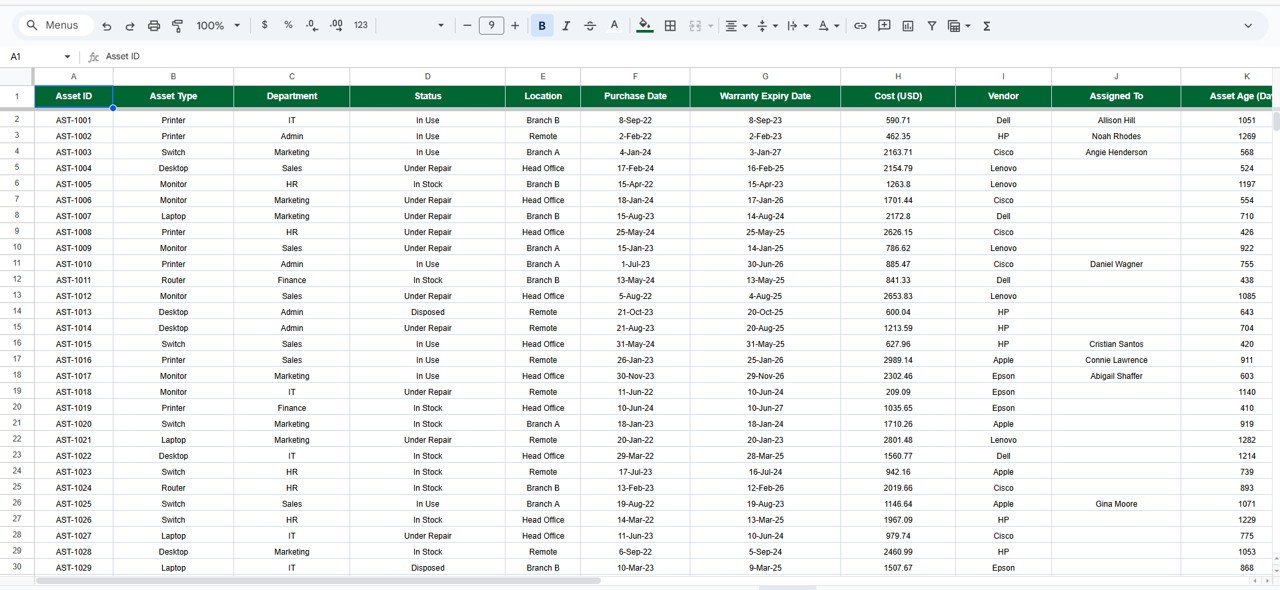
7. Data Sheet Tab
This is the foundation of the dashboard where all asset-related data is stored.
Typical Columns Include:
- Asset ID
- Asset Type
- Department
- Vendor
- Purchase Date
- Purchase Cost (USD)
- Depreciation Value (USD)
- Net Book Value (USD)
- Warranty Expiry Date
- Asset Status (Active/Inactive)
- Location
The dashboard automatically updates visuals and calculations based on this data.
Click to Buy IT Asset Management Dashboard in Google Sheets
Advantages of the IT Asset Management Dashboard
-
Centralized Control: Monitor all assets, costs, and values in one dashboard.
-
Real-Time Analysis: Data updates automatically as you input new values.
-
Cost Transparency: Identify high-cost assets and track depreciation trends.
-
Department Accountability: See which teams utilize assets effectively.
-
Vendor Management: Evaluate vendor reliability and warranty coverage.
-
Data Visualization: Charts and cards simplify complex financial data.
-
No Technical Skills Required: Built in Google Sheets for universal accessibility.
Opportunities for Improvement
Although powerful, the dashboard can be enhanced with automation and integrations:
-
Automated Alerts: Set Google Apps Script to notify when warranties expire.
-
Barcode/QR Integration: Link asset barcodes for quick lookup.
-
Form-Based Entry: Use Google Forms for simple asset registration.
-
Geo-Mapping: Visualize asset distribution by office locations.
-
Predictive Depreciation Modeling: Forecast replacement costs using built-in formulas.
Best Practices for Using the Dashboard
Click to Buy IT Asset Management Dashboard in Google Sheets
-
Keep Data Updated: Enter new purchases and disposals monthly.
-
Validate Depreciation Formulas: Ensure all values reflect accurate calculations.
-
Classify Assets Properly: Maintain consistent naming conventions for asset types.
-
Review Department Usage: Identify underutilized or redundant equipment.
-
Archive Old Data: Move disposed assets to a historical log.
-
Protect Sensitive Fields: Restrict editing of key formulas and totals.
Conclusion
The IT Asset Management Dashboard in Google Sheets is a powerful yet simple tool for managing your IT infrastructure. It provides instant insights into cost, depreciation, net book value, and warranty status — helping teams plan better, reduce risk, and optimize spending.
With its fully interactive charts, search function, and financial summaries, this dashboard transforms how organizations manage IT assets — ensuring transparency, accountability, and efficiency.
Frequently Asked Questions (FAQ)
Click to Buy IT Asset Management Dashboard in Google Sheets
1. Can I track software licenses using this dashboard?
Yes. You can add software assets as separate records in the data sheet.
2. How does the dashboard calculate depreciation?
Depreciation is calculated using simple straight-line or percentage-based formulas you define in the data sheet.
3. Can I see which assets are nearing warranty expiry?
Yes. Filter by “Warranty Expiry Date” or add conditional formatting alerts.
4. Can multiple users update the dashboard simultaneously?
Yes. Google Sheets allows real-time collaboration with permissions.
5. Can I customize the KPIs or charts?
Absolutely. You can modify or add KPIs and charts as per your organization’s needs.
Visit our YouTube channel to learn step-by-step video tutorials
Youtube.com/@NeotechNavigators