Managing IT services effectively requires constant monitoring and optimization of service requests, resolution times, response times, and customer satisfaction. The IT Services Dashboard in Google Sheets is a powerful tool that allows IT service managers and teams to track and analyze key performance indicators (KPIs) related to service requests. This ready-to-use dashboard helps ensure that IT services are delivered efficiently, keeping track of requests, technician performance, service levels, and customer ratings.
In this article, we will explain the key features of the IT Services Dashboard in Google Sheets and how it can help IT departments streamline their service management processes.
What is the IT Services Dashboard in Google Sheets?
The IT Services Dashboard in Google Sheets is a comprehensive tool that enables IT service teams to monitor and analyze their performance in real time. It tracks key metrics such as the number of service requests, resolution time, response time, customer satisfaction, SLA breaches, and more. This dashboard provides a high-level overview of the IT service department’s performance, as well as detailed insights into specific aspects of service delivery.
The dashboard consists of multiple sheets, including a Dashboard Sheet, Search Sheet, and Data Sheet, which all work together to provide a full view of IT service performance.
Key Features of the IT Services Dashboard
Click to buy IT Services Dashboard in Google Sheets
1) Dashboard Sheet Tab: Key Metrics and Analysis
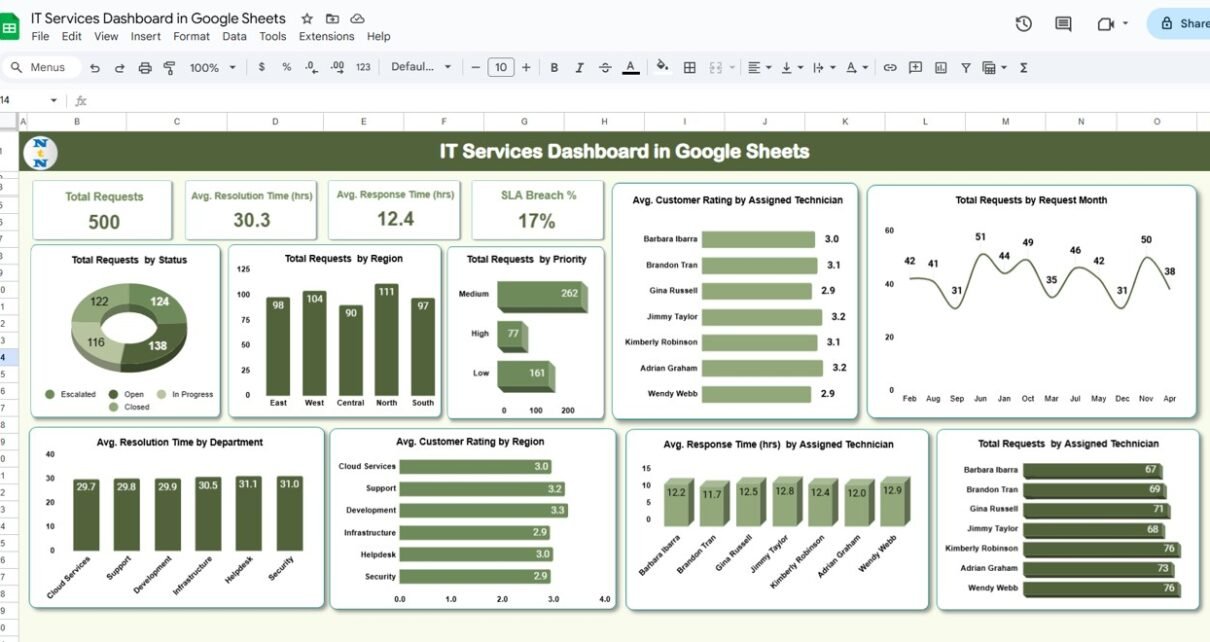
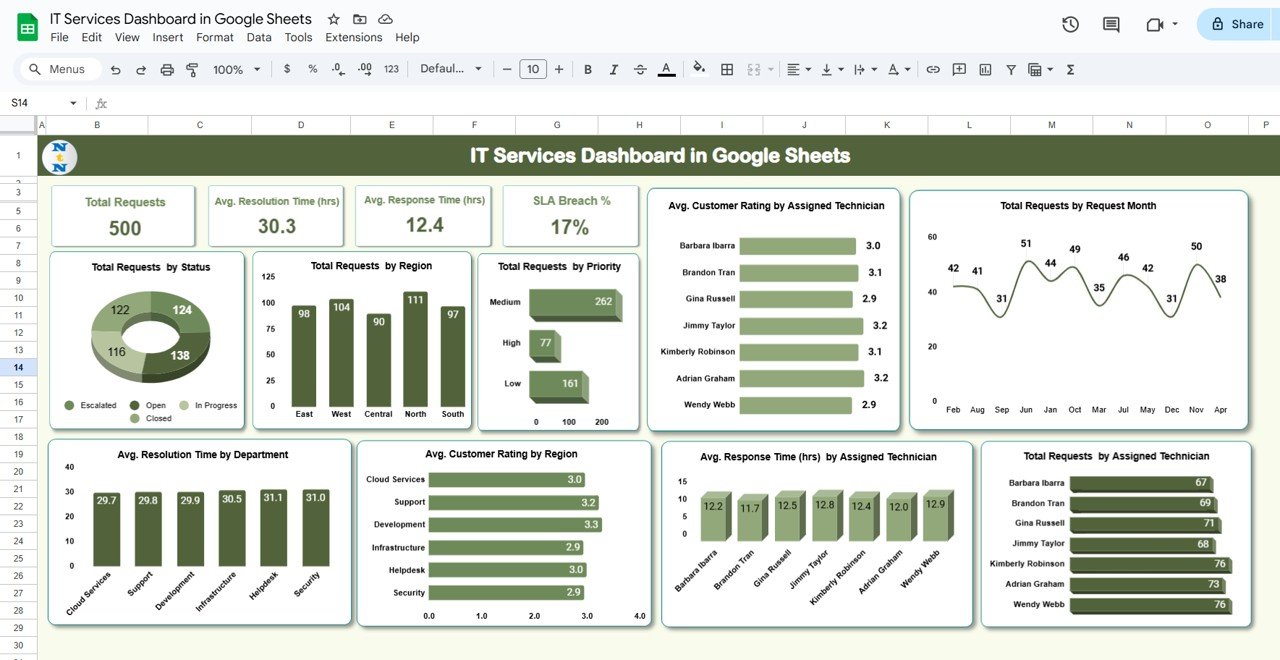
The Dashboard Sheet is the central hub of the dashboard, providing key metrics and visualizations to track IT service performance. The sheet includes:
Cards:
- Total Requests: Displays the total number of service requests submitted.
- Avg. Resolution Time (hrs): Shows the average time taken to resolve service requests.
- Avg. Response Time (hrs): Displays the average time taken to respond to service requests.
- SLA Breach Count: Tracks the number of service requests that breached the Service Level Agreement (SLA).
- SLA Breach %: Shows the percentage of service requests that breached the SLA.
These cards provide a quick snapshot of the overall performance of the IT service department, allowing managers to see key metrics at a glance.
Charts:
- Total Requests by Status: Breaks down service requests based on their current status (e.g., open, in progress, closed).
- Total Requests by Region: Displays the number of service requests from different regions (e.g., North, South, East, West).
- Total Requests by Priority: Tracks service requests by their priority level (e.g., low, medium, high).
- Avg. Customer Rating by Assigned Technician: Displays the average customer satisfaction rating for each technician.
- Total Requests by Request Month: Visualizes the number of requests submitted each month.
- Avg. Resolution Time by Department: Displays the average resolution time for service requests by department.
- Avg. Customer Rating by Region: Shows the average customer satisfaction rating by region.
- Avg. Response Time (hrs) by Assigned Technician: Tracks the average response time for each technician.
- Total Requests by Assigned Technician: Shows the total number of service requests handled by each technician.
These charts provide valuable insights into the performance of IT services, helping you identify trends, spot potential bottlenecks, and improve service delivery.
Click to buy IT Services Dashboard in Google Sheets
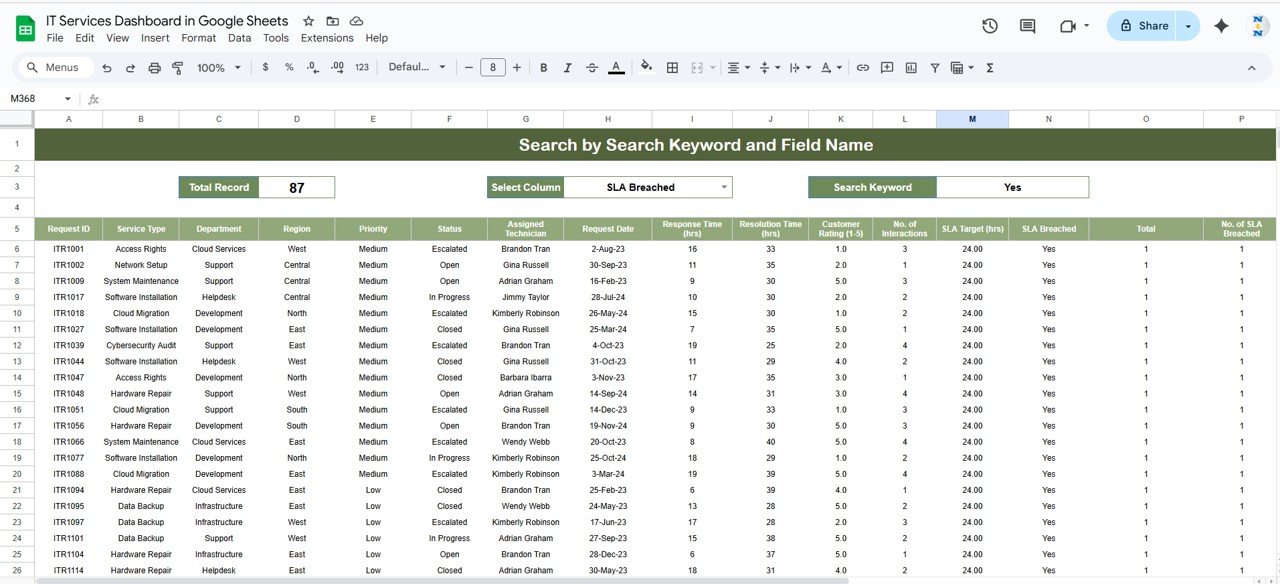
2) Search Sheet Tab: Easy Data Lookup
The Search Sheet allows you to search and filter service request data quickly. Key features include:
-
Search by Search Keyword and Field Name: Allows you to filter the data by specific fields such as SLA status, request priority, or technician name.
-
Total Record Count: Displays the total number of records matching your search criteria.
-
Column Selection: Lets you choose which column to search through, such as service type, department, or status.
This sheet is helpful for quickly retrieving specific information, making it easier to analyze and act on particular service requests.
Click to buy IT Services Dashboard in Google Sheets
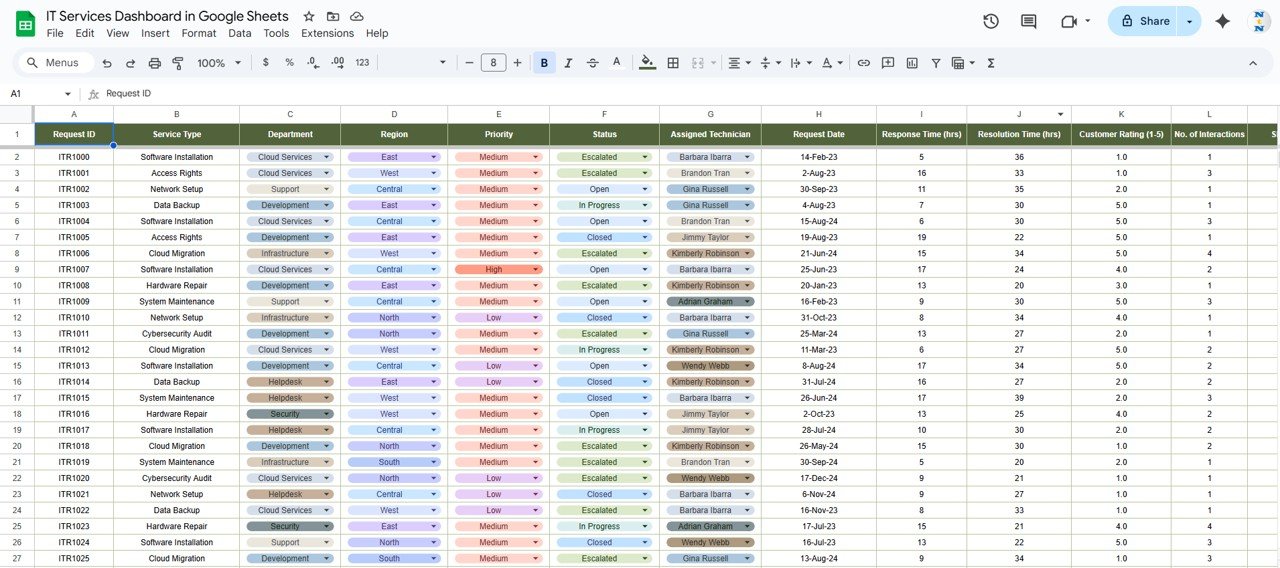
3) Data Sheet Tab: Input and Manage Raw Data
The Data Sheet serves as the foundation of the dashboard, where all service request data is entered. Key columns in this sheet include:
- ID: A unique identifier for each service request.
- Service Type: The type of service requested (e.g., software installation, network setup, cloud migration).
- Department: The department responsible for resolving the request (e.g., support, development, helpdesk).
- Region: The region where the service request originated.
- Priority: The priority level of the request (e.g., high, medium, low).
- Status: The current status of the request (e.g., open, closed, in progress).
- Assigned Technician: The technician assigned to handle the request.
- Request Date: The date the service request was submitted.
- Response Time (hrs): The time it took to respond to the request.
- Resolution Time (hrs): The time it took to resolve the request.
- Customer Rating (1-5): The customer’s rating of the service (1 being poor, 5 being excellent).
- No. of Interactions: The number of interactions with the customer.
- SLA Target (hrs): The agreed-upon SLA response or resolution time for the request.
- SLA Breached: Indicates whether the SLA was breached (Yes/No).
- Total: The total cost associated with the service request.
- No. of SLA Breached: Tracks the number of SLA breaches for the service request.
This sheet captures all relevant data for each service request and feeds the metrics displayed in the Dashboard Sheet.
Benefits of Using the IT Services Dashboard
The IT Services Dashboard offers several advantages for IT departments and service managers:
-
Comprehensive Tracking: The dashboard allows you to track all aspects of service request management, from response and resolution times to SLA breaches and customer satisfaction.
-
Real-Time Insights: The charts and cards provide real-time updates, allowing you to monitor service performance continuously.
-
Data-Driven Decision Making: By analyzing the data, you can identify areas of improvement, optimize workflows, and make data-driven decisions to enhance service delivery.
-
Improved SLA Management: The dashboard helps you track SLA breaches, ensuring that service levels are maintained and customer expectations are met.
-
Customizable: The template is fully customizable, allowing you to add new columns, charts, or KPIs based on your specific needs.
Best Practices for Using the IT Services Dashboard
Click to buy IT Services Dashboard in Google Sheets
To maximize the effectiveness of the IT Services Dashboard, follow these best practices:
- Update Data Regularly: Ensure that the Data Sheet is updated with new service request data as soon as it is available. This will keep the dashboard up-to-date and provide accurate insights.
- Monitor SLA Performance: Keep a close eye on the SLA Breach Count and SLA Breach % to ensure that service requests are being resolved within the agreed-upon timeframes.
- Track Technician Performance: Use the Avg. Customer Rating by Assigned Technician and Avg. Response Time (hrs) by Assigned Technician charts to monitor technician performance and identify areas for improvement.
- Analyze Trends: Regularly review the charts to spot trends in service request volume, resolution time, and customer satisfaction. Use this data to optimize processes and allocate resources efficiently.
- Collaborate with Your Team: Share the dashboard with your team to ensure everyone has access to real-time data and can work together to address service issues promptly.
Conclusion
The IT Services Dashboard in Google Sheets is a powerful tool for managing and optimizing IT service requests. By providing real-time insights into key performance metrics such as response time, resolution time, SLA breaches, and customer ratings, this dashboard helps IT service teams track performance and improve service delivery. With its customizable features and visual charts, the IT Services Dashboard is an invaluable resource for any IT department looking to streamline service management and enhance customer satisfaction.
Frequently Asked Questions (FAQs)
1. How often should I update the IT Services Dashboard?
It is recommended to update the Data Sheet regularly, ideally after each service request is submitted or resolved, to ensure the dashboard is always up-to-date.
2. Can I track multiple service types with this dashboard?
Yes, the dashboard can track multiple service types by using the Service Type column in the Data Sheet, and it will display relevant data for each service type in the charts.
3. Can I customize the dashboard for my specific IT service needs?
Yes, the dashboard is fully customizable. You can modify the charts, columns, and KPIs to suit your specific service management needs.
4. How does the SLA Breach analysis work?
The dashboard tracks SLA breaches by comparing the actual response and resolution times with the agreed-upon SLA targets. It flags requests that exceed the SLA, helping you manage service levels effectively.
5. How do I analyze technician performance?
You can use the Avg. Customer Rating by Assigned Technician and Avg. Response Time (hrs) by Assigned Technician charts to assess technician performance and identify areas for improvement.
Visit our YouTube channel to learn step-by-step video tutorials
Youtube.com/@NeotechNavigators
Click to buy IT Services Dashboard in Google Sheets