In the fast-paced legal environment, staying on top of key performance indicators (KPIs) is essential for tracking progress, improving efficiency, and ensuring smooth operations. A Legal KPI Dashboard in Google Sheets provides law firms and legal departments with an intuitive, easily accessible way to track critical data points related to their legal operations. This article dives into the creation, benefits, and best practices for using a Legal KPI Dashboard in Google Sheets, with a focus on how it can streamline workflows and improve performance analysis.
What is a Legal KPI Dashboard in Google Sheets?
A Legal KPI Dashboard is a tool that helps legal teams monitor and track their performance in real-time. Using Google Sheets as a platform makes it easily customizable, cost-effective, and accessible from anywhere. KPIs in the legal context often include metrics such as case outcomes, billable hours, client satisfaction, and time-to-resolution.
A well-organized Legal KPI Dashboard consolidates this data in a single view, helping stakeholders make informed decisions, assess the performance of legal teams, and optimize workflows. Google Sheets offers the advantage of collaboration, ease of use, and integration with other Google tools, making it an ideal platform for such dashboards.
Key Features of the Legal KPI Dashboard in Google Sheets
Click to buy Legal KPI Dashboard in Google Sheets
The Legal KPI Dashboard in Google Sheets consists of six main worksheets, each serving a unique purpose in tracking legal operations:
1. Dashboard Sheet Tab
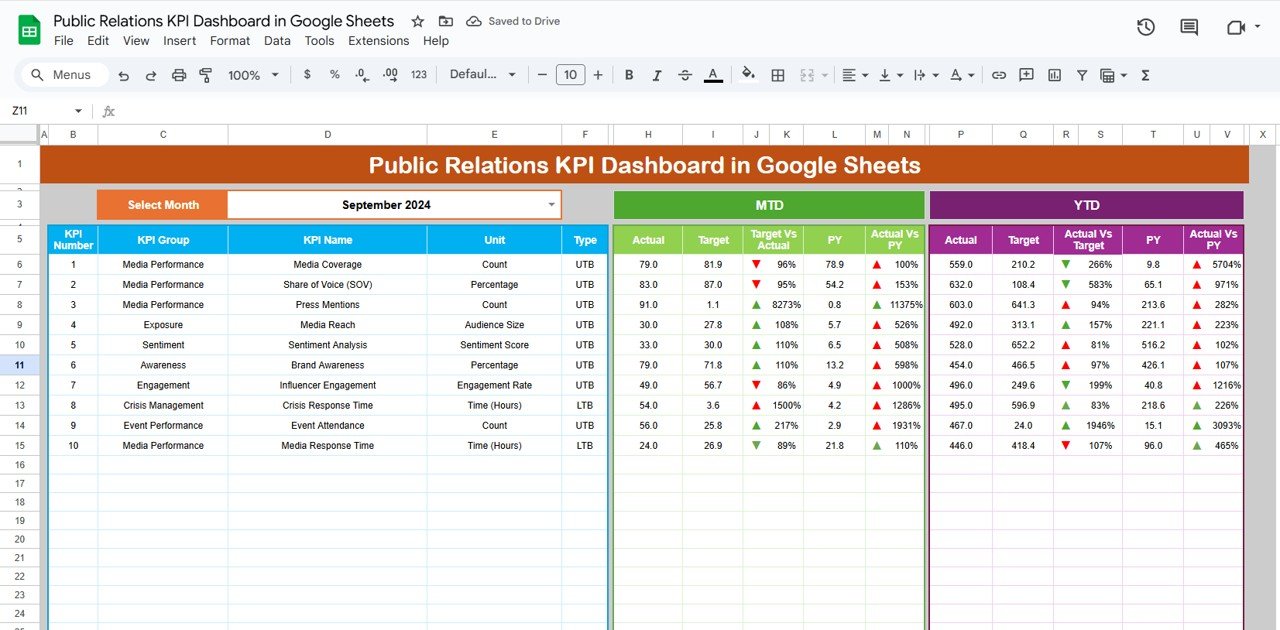
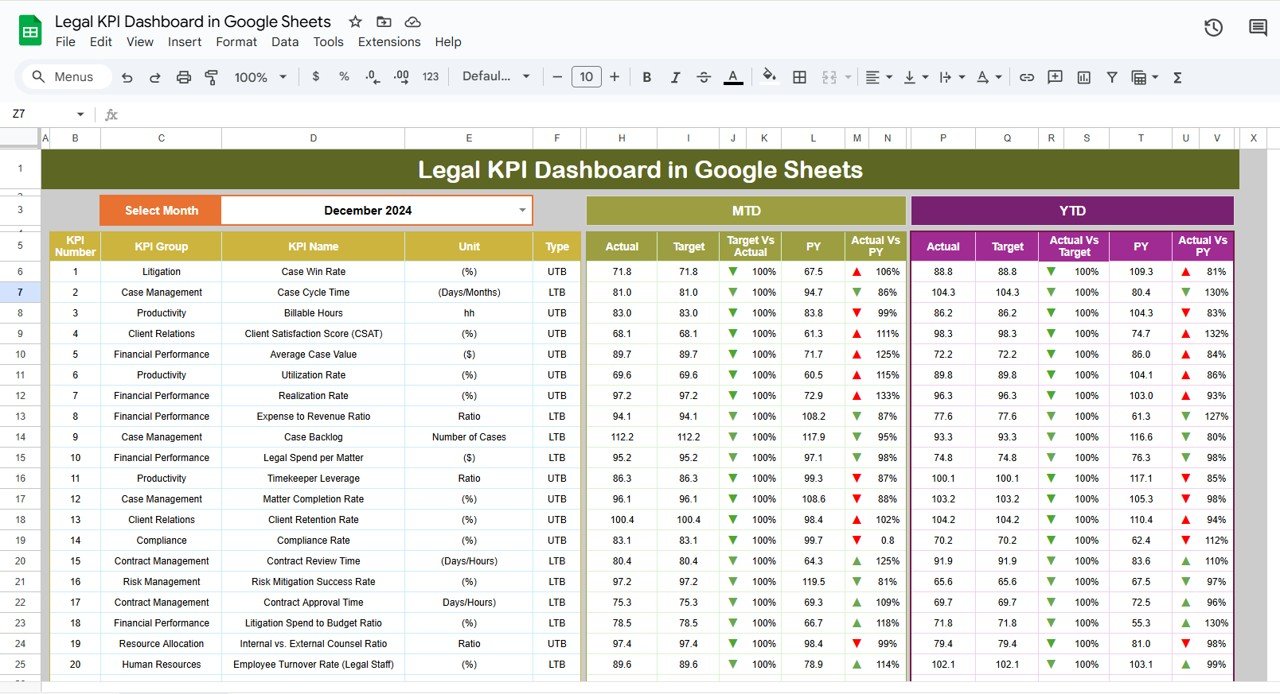
The Dashboard Sheet is the heart of the KPI dashboard. Here, users can view critical data about all KPIs. The dashboard is interactive, allowing you to select a specific month from the dropdown in D3. This selection updates the entire dashboard, providing data relevant to the chosen timeframe.
Key features of this sheet:
-
MTD (Month-to-Date) Actuals: Displays the current month’s performance against set targets.
-
Target vs. Actual: Uses conditional formatting (up/down arrows) to visually highlight performance.
-
PY (Previous Year) vs. Actual: Compares current data with last year’s performance to identify trends.
Click to buy Legal KPI Dashboard in Google Sheets
2. KPI Trend Sheet Tab
The KPI Trend Sheet offers a detailed view of the selected KPI. By choosing the KPI name from the dropdown in C3, users can see:
-
KPI Group
-
Unit of KPI
-
Type of KPI (whether “Lower the Better” or “Upper the Better”)
-
Formula of KPI
-
Definition of KPI
This sheet helps users understand the context behind each KPI and how it’s calculated, offering valuable insights for analysis.

Click to buy Legal KPI Dashboard in Google Sheets
3. Actual Number Sheet Tab
In the Actual Number Sheet, users enter the YTD (Year-to-Date) and MTD values for a given month. The data is updated by changing the month in E1, which auto-fills the relevant values for that month.
This sheet is essential for maintaining up-to-date performance data, allowing teams to track progress in real-time.

Click to buy Legal KPI Dashboard in Google Sheets
4. Target Sheet Tab
The Target Sheet is where users input the target values for each KPI. These targets are defined for both MTD and YTD periods, and they act as benchmarks to compare against actual performance.

5. Previous Year Number Sheet Tab
This sheet stores the data from the previous year, allowing you to compare year-over-year performance. Having this data helps to identify trends and measure improvements over time.

Click to buy Legal KPI Dashboard in Google Sheets
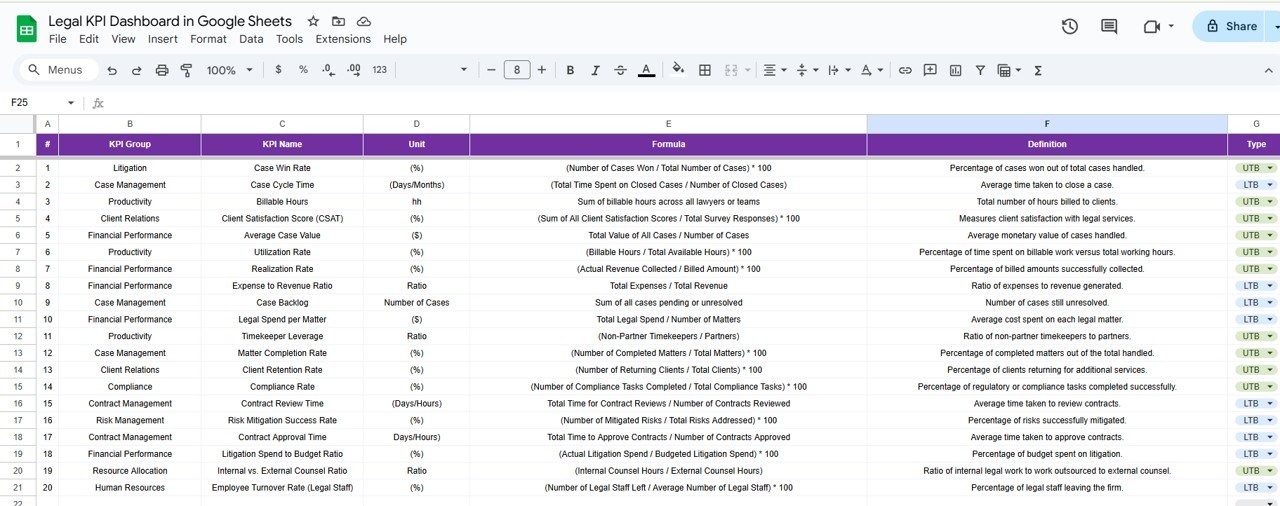
6. KPI Definition Sheet Tab
The KPI Definition Sheet is where all KPIs are defined in detail. Here, users input:
-
KPI Name
-
KPI Group
-
Unit
-
Formula
-
Definition
This sheet ensures that all stakeholders are aligned on the meaning and calculation of each KPI, ensuring consistency and accuracy in reporting.
Advantages of Using a Legal KPI Dashboard
The use of a Legal KPI Dashboard brings several key advantages to legal teams and law firms:
- Improved Performance Monitoring: A Legal KPI Dashboard allows teams to continuously monitor their performance, ensuring they stay on track to meet their targets. Real-time tracking enables quicker adjustments and helps identify issues early on.
- Data-Driven Decision Making: The dashboard provides visual data, making it easier to spot trends, successes, and areas needing improvement. This empowers legal teams to make informed decisions based on actual performance rather than assumptions.
- Streamlined Workflow: By centralizing all legal performance data in one place, the dashboard eliminates the need for multiple spreadsheets or tools. This streamlines the workflow, reduces errors, and saves time for busy legal professionals.
- Increased Accountability: With KPIs clearly defined and tracked, team members can be held accountable for their contributions. This fosters a culture of responsibility and encourages higher performance standards.
- Cost-Efficient: Google Sheets is a free tool, making it an affordable solution for law firms and legal teams. There’s no need for expensive dashboard software or additional IT resources, as Google Sheets offers all the functionality required for effective KPI tracking.
Opportunities for Improvement in Legal KPI Dashboards
Click to buy Legal KPI Dashboard in Google Sheets
While the Legal KPI Dashboard in Google Sheets offers a variety of benefits, there are always opportunities for improvement:
- Integration with Legal Management Systems: Integrating the dashboard with case management systems or billing software could automate data entry and reduce the risk of manual errors. This would make the dashboard even more powerful and efficient.
- Enhanced Data Visualization: Incorporating advanced data visualization tools such as heatmaps, trend lines, or pie charts could provide deeper insights and make the dashboard more visually engaging.
- Real-Time Data Updates: Incorporating real-time data from external sources, such as court databases or case management systems, would make the dashboard even more accurate and up-to-date.
- Mobile Accessibility: Optimizing the dashboard for mobile use would allow legal teams to access critical data on the go, increasing convenience and accessibility.
Best Practices for the Legal KPI Dashboard
To maximize the effectiveness of the Legal KPI Dashboard, it’s essential to follow these best practices:
- Regularly Update Your KPIs: KPIs should reflect current business goals. Regularly assess whether your KPIs are still aligned with your legal team’s objectives and make adjustments if necessary.
- Keep It Simple and Clear: Avoid cluttering the dashboard with too much information. Focus on the most relevant KPIs and ensure that the data is easy to understand for all stakeholders.
- Use Conditional Formatting Wisely: Leverage conditional formatting to highlight key performance trends, such as highlighting KPIs that are below target with a red background and those that exceed expectations in green.
- Automate Data Entry Where Possible: Automating data entry from external sources, such as case management systems or CRM platforms, can save time and reduce errors in the dashboard.
- Provide Regular Reviews: Schedule regular reviews to assess progress, adjust targets, and discuss the insights derived from the dashboard. This ensures that the dashboard remains a dynamic tool for continuous improvement.
Conclusion
Click to buy Legal KPI Dashboard in Google Sheets
A Legal KPI Dashboard in Google Sheets is a powerful tool for improving performance, tracking progress, and making data-driven decisions in the legal field. By using this simple yet effective tool, legal teams can monitor key metrics, optimize workflows, and enhance overall efficiency. The flexibility of Google Sheets, combined with the structured approach of a well-designed dashboard, makes it a valuable asset for any legal team.
Frequently Asked Questions
1. What KPIs are commonly used in a Legal KPI Dashboard?
Common KPIs in a Legal KPI Dashboard include case outcomes, billable hours, client satisfaction, time to resolution, and legal expenses.
2. How can a Legal KPI Dashboard improve decision-making?
By providing real-time, visual data on legal operations, the dashboard helps decision-makers quickly identify trends, assess performance, and make informed decisions.
3. Can I customize the KPIs in the dashboard?
Yes, the dashboard is highly customizable, allowing you to adjust KPIs, targets, and formulas to fit the specific needs of your legal team.
4. How often should I update the data in the Legal KPI Dashboard?
It’s recommended to update the dashboard at least monthly or quarterly, depending on the nature of the KPIs being tracked and the frequency of operational changes.
5. Is Google Sheets the best tool for a Legal KPI Dashboard?
Google Sheets is an excellent tool due to its ease of use, accessibility, and collaboration features. However, larger firms or teams might opt for more advanced dashboard solutions as their needs grow.
Visit our YouTube channel to learn step-by-step video tutorials
Youtube.com/@NeotechNavigators
Click to buy Legal KPI Dashboard in Google Sheets