The luxury goods industry is one of the most competitive sectors, requiring businesses to track performance carefully. Monitoring key performance indicators (KPIs) is essential to staying ahead in the market. A Luxury Goods KPI Dashboard in Google Sheets offers a dynamic and efficient way to monitor and analyze performance metrics related to your luxury goods business. This article will guide you through the features, KPIs, and best practices associated with using this dashboard to track your business’s key metrics.
What is a Luxury Goods KPI Dashboard?
A Luxury Goods KPI Dashboard is a data visualization tool that allows businesses to track important metrics, such as sales performance, customer satisfaction, market share, and inventory turnover. By using KPIs, businesses can evaluate their strengths, identify areas for improvement, and make data-driven decisions. The Google Sheets dashboard template is designed to streamline this process, making it easy to manage and analyze your business’s performance.
Key Features of the Luxury Goods KPI Dashboard
This Luxury Goods KPI Dashboard in Google Sheets template comes with several key features designed to help you monitor all aspects of your business:
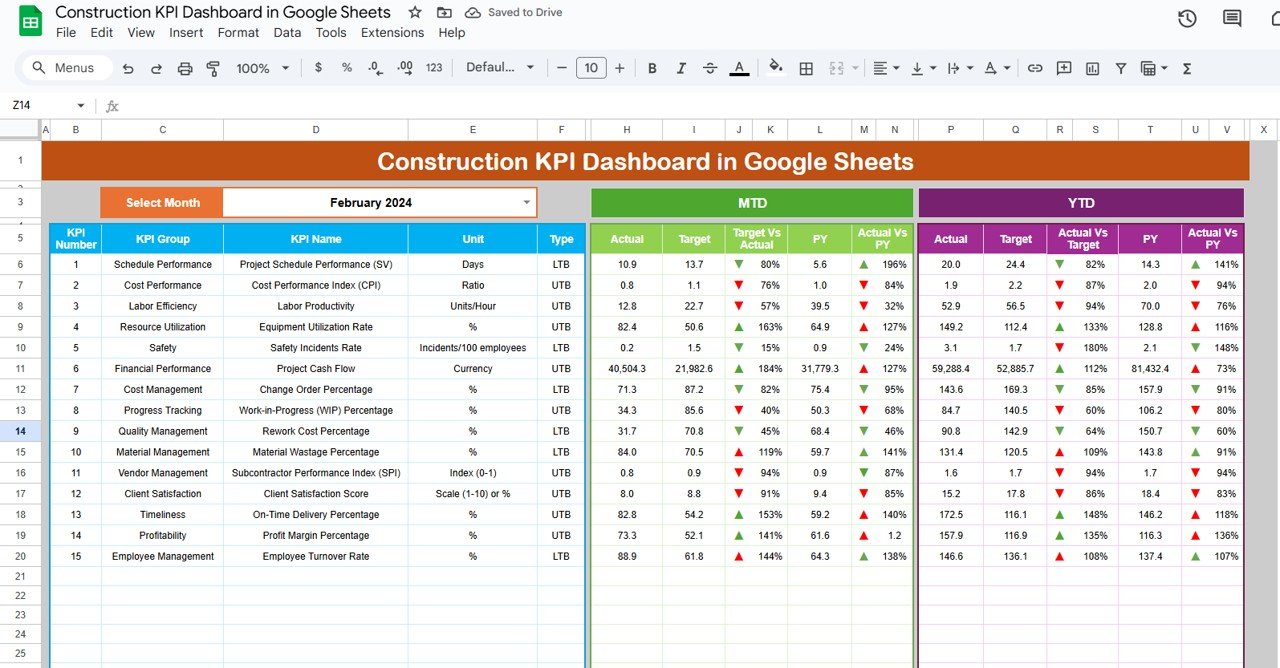
Dashboard Sheet Tab:
- This is the main sheet where all the essential KPI information is displayed.
- You can select the month from the dropdown (range D3), and the entire dashboard will update for that month.
- The dashboard shows MTD (Month-to-Date) and YTD (Year-to-Date) actuals, targets, and previous year data.
- The performance comparison is displayed with Target vs. Actual and Previous Year vs. Actual, along with conditional formatting (up/down arrows).

Click to buy Luxury Goods KPI Dashboard in Google Sheets
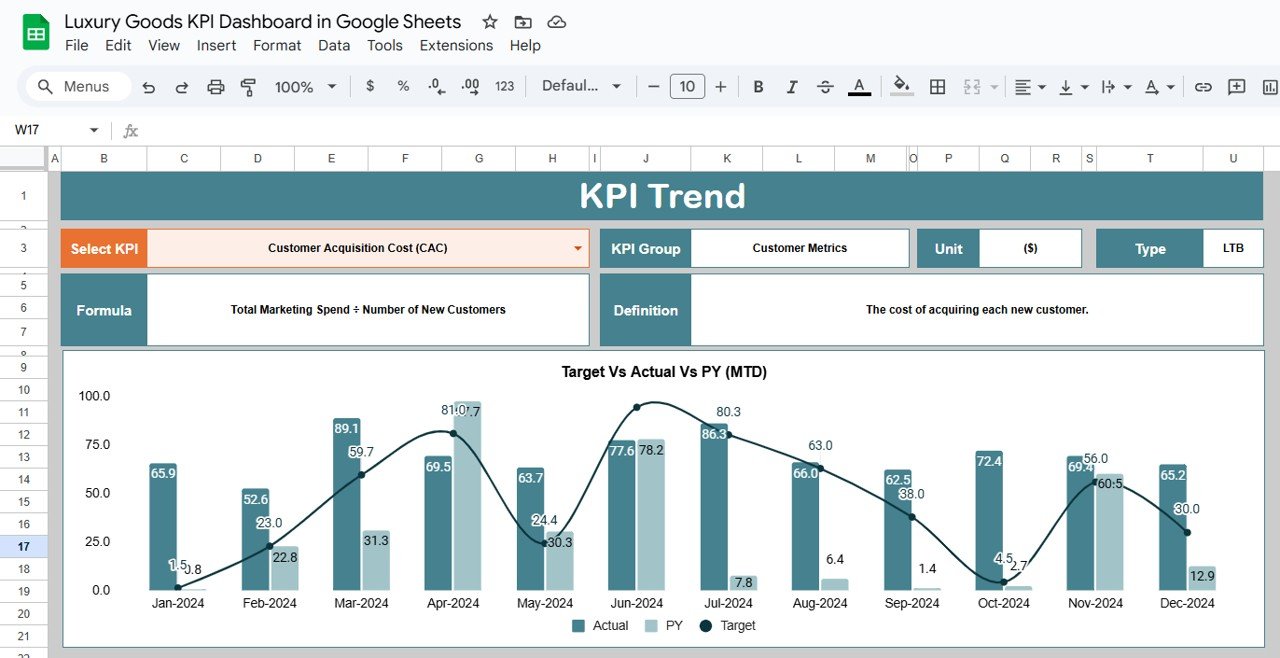
KPI Trend Sheet Tab:
- Here, you can select a specific KPI from a dropdown (range C3).
- The sheet displays the KPI Group, Unit of Measure, KPI Type (Lower the Better or Upper the Better), Formula, and KPI Definition for each KPI.
Click to buy Luxury Goods KPI Dashboard in Google Sheets
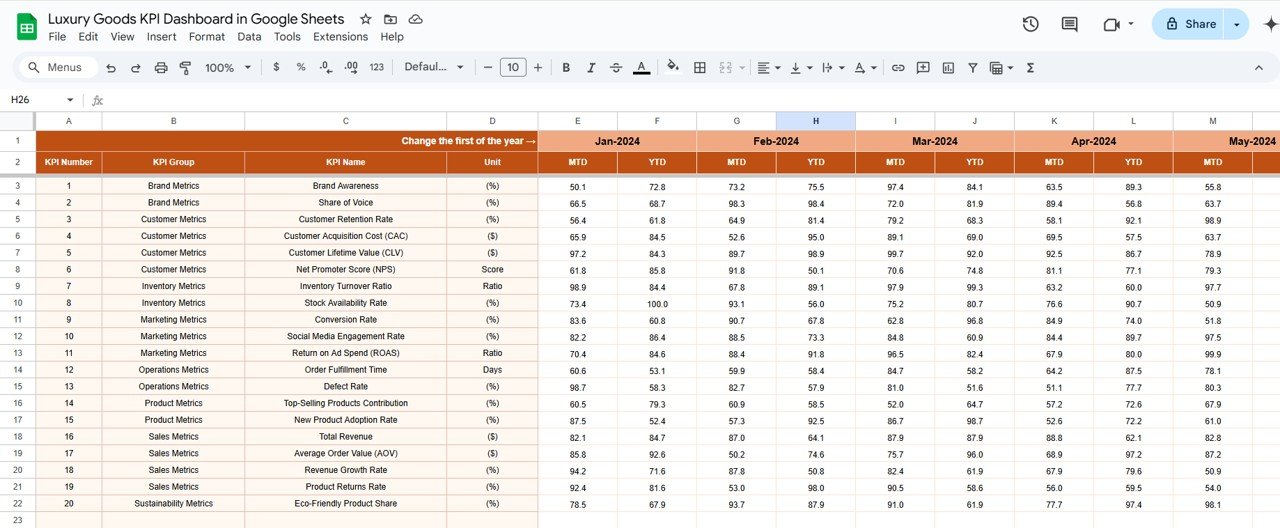
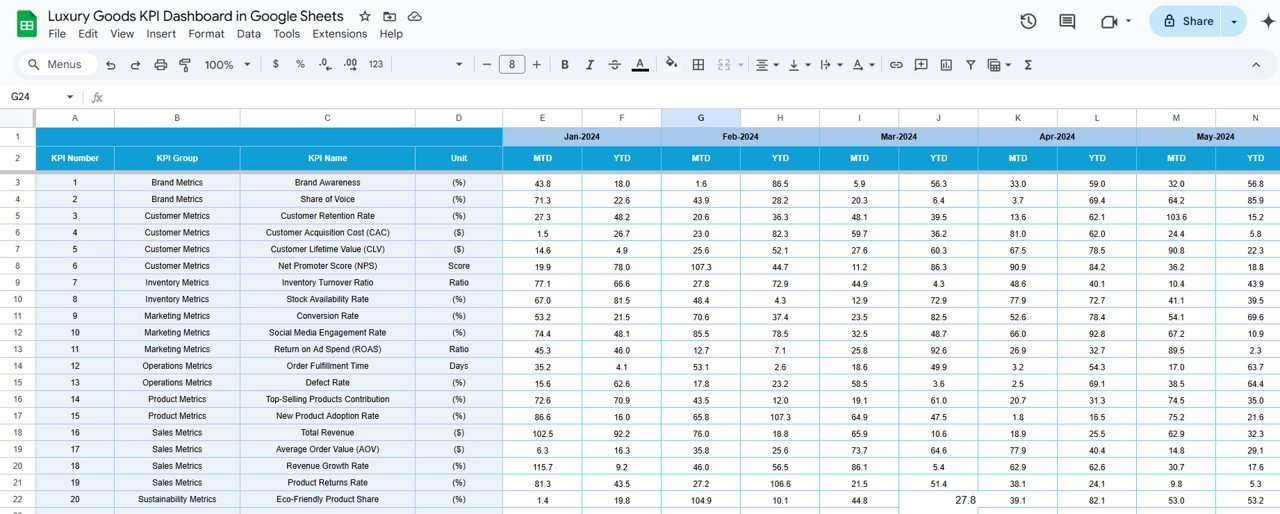
Actual Number Sheet Tab:
- This is where you input actual numbers for YTD and MTD for the selected month.
- You can change the first month of the year (range E1) to update your data accordingly.
Target Sheet Tab:
- Enter the target numbers for each KPI for MTD and YTD in this sheet.
Click to buy Luxury Goods KPI Dashboard in Google Sheets
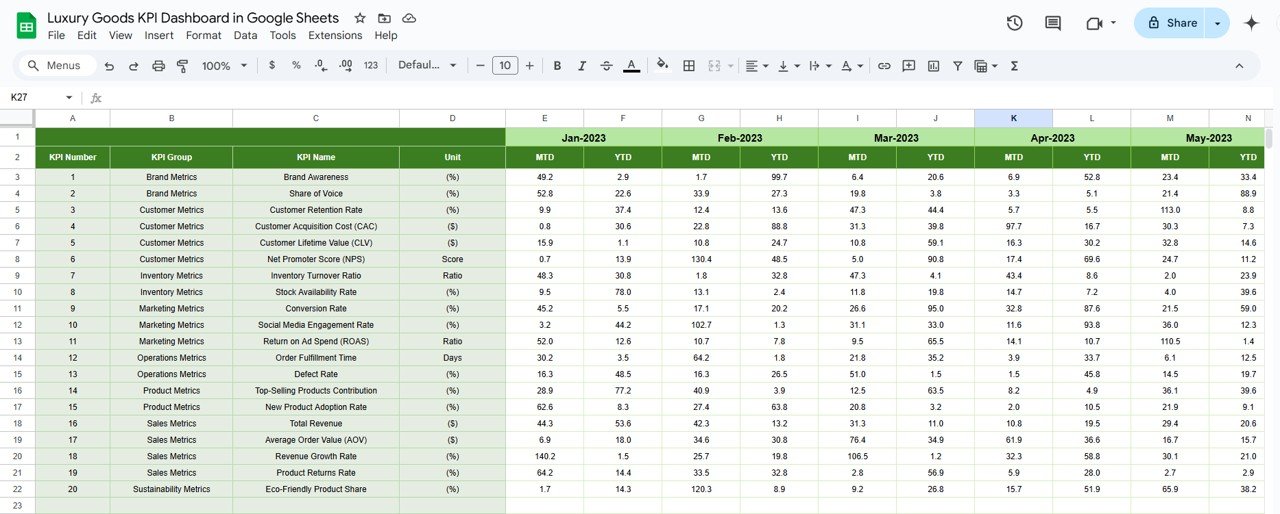
Previous Year Number Sheet Tab:
- This tab allows you to input previous year data to track performance comparisons with the current year.
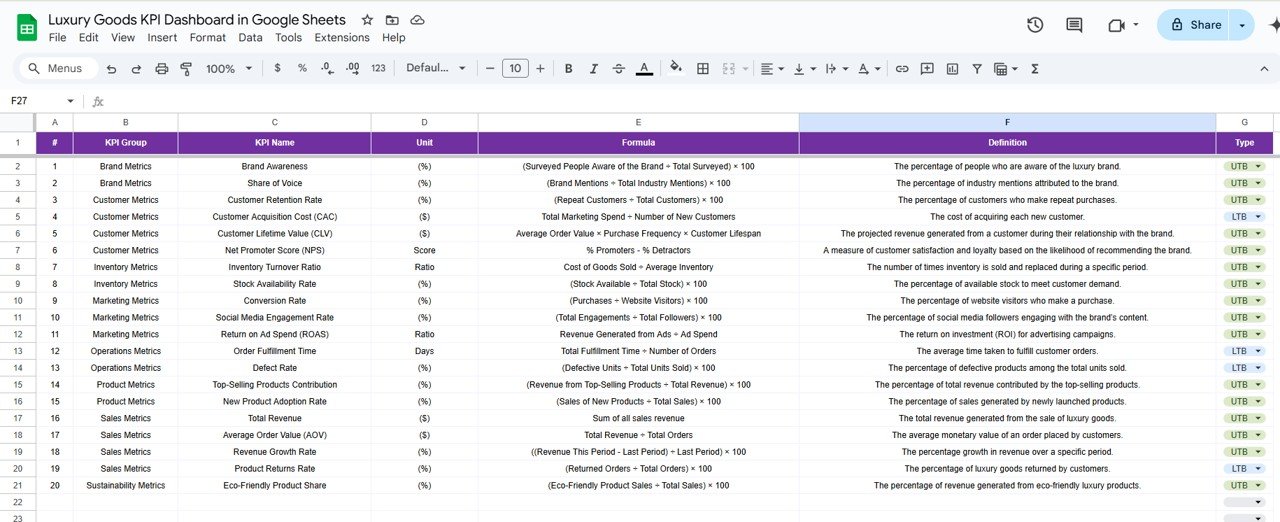
KPI Definition Sheet Tab:
- This sheet allows you to define each KPI, including the KPI Name, KPI Group, Unit, Formula, and KPI Definition for clarity and consistency.
Advantages of Using a Luxury Goods KPI Dashboard
There are several advantages to using a Luxury Goods KPI Dashboard:
-
Improved Data Visibility:
With all the critical metrics in one place, the dashboard makes it easier to track performance and make informed decisions. -
Real-Time Performance Monitoring:
The dashboard updates automatically, allowing for real-time monitoring of KPIs and performance metrics. -
Data-Driven Decision Making:
By tracking key KPIs like sales revenue, customer retention, and inventory turnover, businesses can make data-driven decisions to optimize operations. -
Enhanced Strategic Planning:
With a clear overview of performance, businesses can better plan for growth, identify weaknesses, and make adjustments accordingly. -
Improved Customer Experience:
Monitoring customer satisfaction scores and retention rates helps companies improve customer experience, leading to higher brand loyalty and repeat business.
Opportunities for Improvement in the Luxury Goods Industry
Click to buy Luxury Goods KPI Dashboard in Google Sheets
The luxury goods market is constantly evolving. Here are some opportunities for improvement in the industry:
-
Personalization:
Providing a personalized experience can help increase customer satisfaction and retention. Monitoring KPIs related to customer feedback and satisfaction can highlight areas where personalization can be improved. -
Digital Transformation:
The luxury goods industry can further benefit from adopting more digital solutions, such as AI-driven recommendations, chatbots for customer service, and enhanced online shopping experiences. -
Sustainability Initiatives:
With growing consumer awareness about sustainability, luxury goods brands should track and improve sustainability metrics. Tracking KPIs like sustainable materials used and eco-friendly packaging can enhance brand value. -
Global Expansion:
Tracking market share and brand awareness globally provides opportunities for luxury brands to expand into new markets, especially emerging economies.
Best Practices for Using the Luxury Goods KPI Dashboard
Click to buy Luxury Goods KPI Dashboard in Google Sheets
To get the most out of the Luxury Goods KPI Dashboard, follow these best practices:
- Consistently Update Data:
Keep the dashboard updated by regularly entering actual data for MTD, YTD, and targets to ensure accurate insights. - Focus on High-Impact KPIs:
Identify the KPIs that directly impact business performance (e.g., sales revenue, customer retention) and focus on improving them. - Analyze Trends:
Use the KPI Trend Sheet to analyze trends over time, enabling you to identify areas for improvement and capitalize on successful strategies. - Set Realistic Targets:
Set achievable targets based on historical data, market trends, and industry benchmarks to maintain motivation and ensure steady growth. - Engage Key Stakeholders:
Share the dashboard with stakeholders, including senior executives, sales teams, and marketing departments, to ensure alignment and accountability.
Conclusion
The Luxury Goods KPI Dashboard in Google Sheets is an indispensable tool for any luxury brand looking to track and improve its business performance. By offering a clear, real-time view of key metrics like sales revenue, customer retention, and market share, the dashboard empowers businesses to make data-driven decisions and optimize their operations. With its easy-to-use features and customizable options, the dashboard can help luxury goods companies stay competitive and grow in an ever-evolving market.
Frequently Asked Questions (FAQs)
Click to buy Luxury Goods KPI Dashboard in Google Sheets
1. What is a KPI Dashboard?
A KPI Dashboard is a tool used to track and monitor key performance indicators (KPIs) in real-time. It provides a visual representation of a company’s performance against predefined targets.
2. How does the Luxury Goods KPI Dashboard help improve business performance?
The dashboard allows businesses to track key metrics like sales revenue, customer satisfaction, and inventory turnover. This data helps businesses identify strengths and weaknesses and make informed decisions to improve performance.
3. Can I customize the Luxury Goods KPI Dashboard?
Yes, the dashboard is customizable. You can adjust the KPIs, targets, and data inputs to fit your luxury goods business needs.
4. How often should I update the data in the dashboard?
It’s recommended to update the dashboard regularly (monthly or weekly) to ensure that you have real-time insights into your business’s performance.
5. How do I use the dashboard for strategic planning?
By analyzing the data in the dashboard, you can identify trends and areas for improvement, helping you plan your business strategy and make informed decisions to grow your brand.
Visit our YouTube channel to learn step-by-step video tutorials
Youtube.com/@NeotechNavigators