In this article, we will explore the Luxury Travel KPI Dashboard in Google Sheets, a ready-to-use template designed to track and analyze key performance indicators (KPIs) related to luxury travel services. This dashboard provides valuable insights into the performance of your luxury travel business by presenting key data in a clean, visual format.
Key Features of the Luxury Travel KPI Dashboard:
The Luxury Travel KPI Dashboard template includes six worksheets:
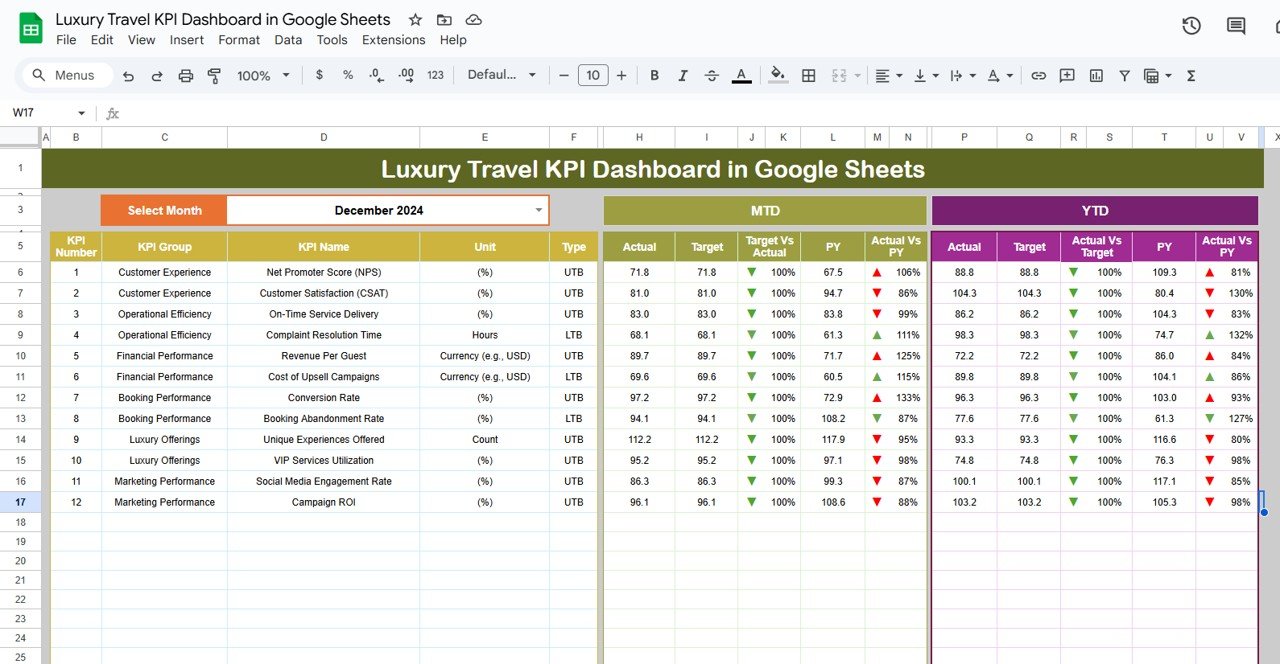
Dashboard Sheet Tab:
This is the main sheet where all KPIs are displayed. Users can select the month using a dropdown in cell D3, and the dashboard will update accordingly. It shows the MTD (Month-to-Date) and YTD (Year-to-Date) actual, target, and previous year data with Target vs Actual and PY vs Actual comparisons, highlighted with conditional formatting.
Click to buy Luxury Travel KPI Dashboard in Google Sheets
KPI Trend Sheet Tab:
This tab allows you to select KPIs and provides a detailed view of the KPI group, unit, type, formula, and definition.

Actual Numbers Sheet Tab:
Here, users enter the actual numbers for both MTD and YTD data for a specific month.

Click to buy Luxury Travel KPI Dashboard in Google Sheets
Target Sheet Tab:
This tab allows you to input target numbers for each KPI, both MTD and YTD, for comparison purposes.

Previous Year Numbers Sheet Tab:
Enter the previous year’s data here, which will be compared against the current year’s data.

Click to buy Luxury Travel KPI Dashboard in Google Sheets
KPI Definition Sheet Tab:
This sheet holds the name, group, unit, formula, and definition for each KPI, providing a clear understanding of the metrics being tracked.

Conclusion
The Luxury Travel KPI Dashboard in Google Sheets is an invaluable tool for monitoring key performance metrics that drive success in the luxury travel industry. With this customizable and ready-to-use template, businesses can easily track and evaluate critical data, enabling them to make informed decisions and improve their operations. By focusing on the KPIs listed in this article, your company can enhance its customer acquisition, retention, and overall profitability.
Frequently Asked Questions (FAQs)
Click to buy Luxury Travel KPI Dashboard in Google Sheets
1. How can I customize the Luxury Travel KPI Dashboard?
You can customize the dashboard by adding or removing KPIs, adjusting the data inputs, and modifying charts to fit your business needs.
2. Can I automate the data entry process in Google Sheets?
While Google Sheets doesn’t support full automation, you can integrate it with third-party tools like Zapier or use Google Apps Script to automate data entry to some extent.
3. What is the benefit of tracking customer satisfaction in the dashboard?
Tracking customer satisfaction helps you gauge the success of your services and identify areas for improvement. A high customer satisfaction score typically leads to higher retention rates and positive word-of-mouth marketing.
4. How do I interpret the “Target vs Actual” data on the dashboard?
The “Target vs Actual” comparison helps you understand whether you are meeting your goals. If the actual number is higher than the target, it’s a sign of strong performance; if it’s lower, you may need to investigate potential causes.
5. How often should I update the data in the dashboard?
Ideally, the data should be updated monthly to ensure that the dashboard reflects the latest performance metrics and provides an accurate picture of business performance.
Visit our YouTube channel to learn step-by-step video tutorials
Youtube.com/@NeotechNavigators
Watch the step-by-step video Demo: