In today’s competitive manufacturing world, tracking and analyzing production data is more crucial than ever. A Manufacturing Dashboard in Google Sheets is a powerful tool designed to help manufacturers track their production performance, monitor quality, and assess efficiency. This comprehensive dashboard offers a simple yet detailed view of key manufacturing metrics in a user-friendly format.
This article explains how the Manufacturing Dashboard in Google Sheets works and how it can be utilized to improve operational efficiency, reduce costs, and boost production. The dashboard uses various sheets to give a holistic overview of manufacturing performance, covering key areas such as production quantity, quality control, cost analysis, and efficiency.
Key Features of the Manufacturing Dashboard
Click to buy Manufacturing Dashboard in Google Sheets
Overview Sheet Tab
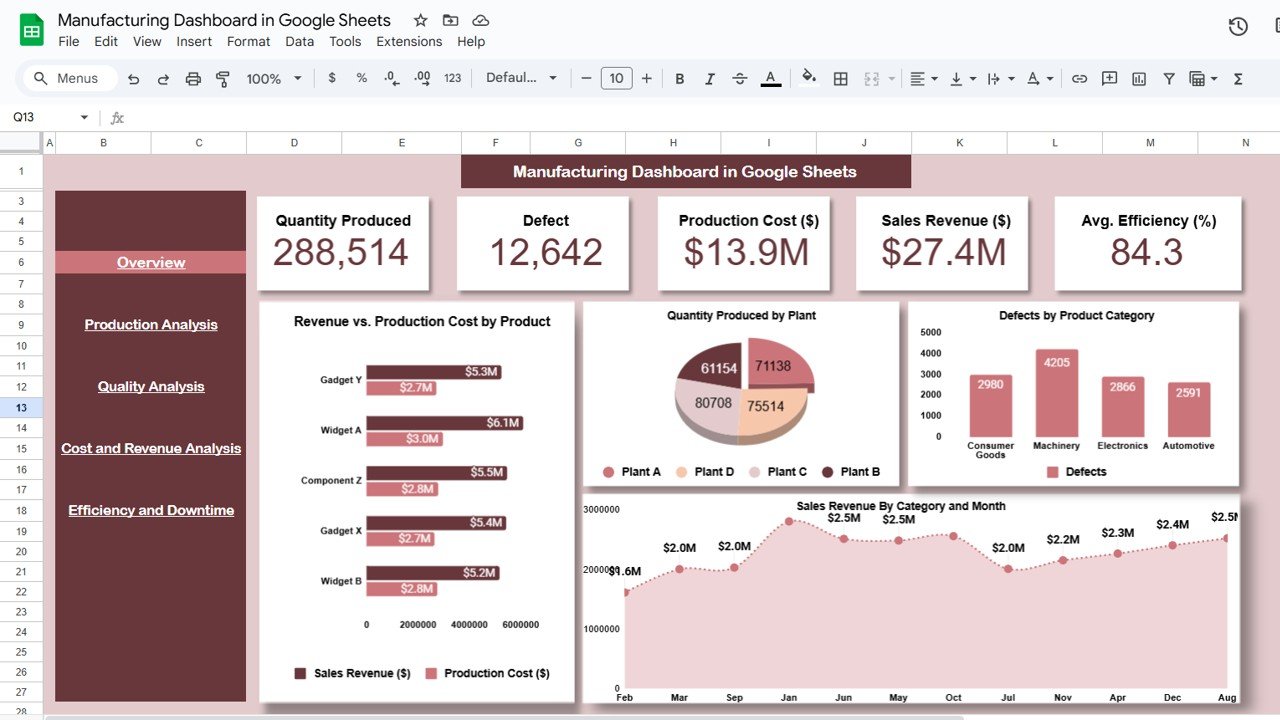
The Overview Sheet serves as the central hub of the manufacturing dashboard. It provides high-level insights into the entire production process. This sheet is populated with multiple types of charts that help you quickly understand the key performance indicators (KPIs) of your manufacturing operation.
Key Data Points in the Overview Sheet:
-
Quantity Produced: The total units of products manufactured within a given time frame.
-
Defects: Tracks the number of defects or quality issues that occurred during the production process.
-
Production Cost ($): The total expenses incurred during production, including labor, materials, and overhead.
-
Sales Revenue ($): The income generated from the sales of products manufactured.
-
Avg. Efficiency (%): A performance metric that indicates how efficiently the production line is operating.
Charts in the Overview Sheet:
-
Revenue vs. Production Cost by Product: Compares the revenue generated with the production cost for each product, highlighting areas where costs can be optimized.
-
Quantity Produced by Plant: Visualizes the output of each plant in the network, helping identify which locations are performing better.
-
Defects by Product Category: Shows which product categories experience more defects, aiding in quality control improvements.
-
Sales Revenue by Category and Month: Tracks revenue generation trends by product category and month, helping forecast sales.
Click to buy Manufacturing Dashboard in Google Sheets
Production Analysis Sheet Tab
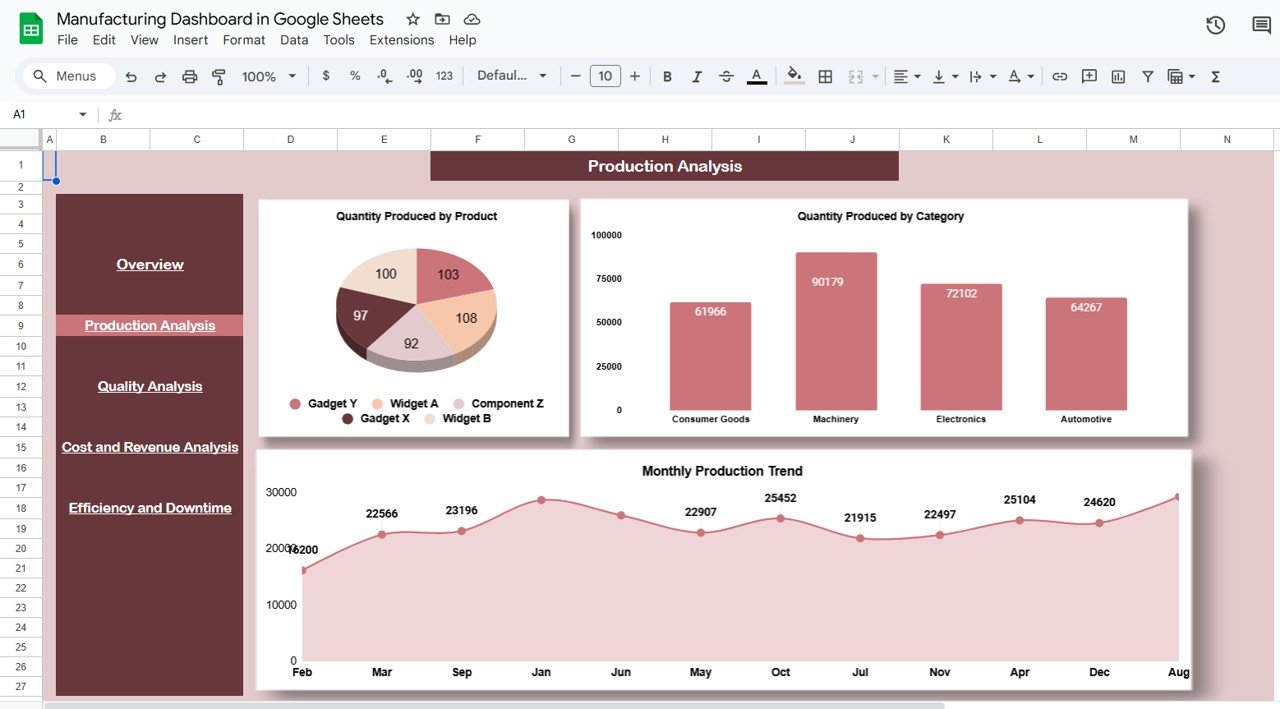
The Production Analysis Sheet goes deeper into the production data, offering insights into the quantity produced by different categories and products. This sheet helps managers and supervisors assess production levels, uncover bottlenecks, and optimize production strategies.
Charts in the Production Analysis Sheet:
-
Quantity Produced by Product: This chart visualizes the output for each product manufactured over time, highlighting underperforming products.
-
Quantity Produced by Category: Helps to analyze the total quantity produced by each product category.
-
Monthly Production Trend: Displays how production numbers have evolved month by month.
Quality Analysis Sheet Tab
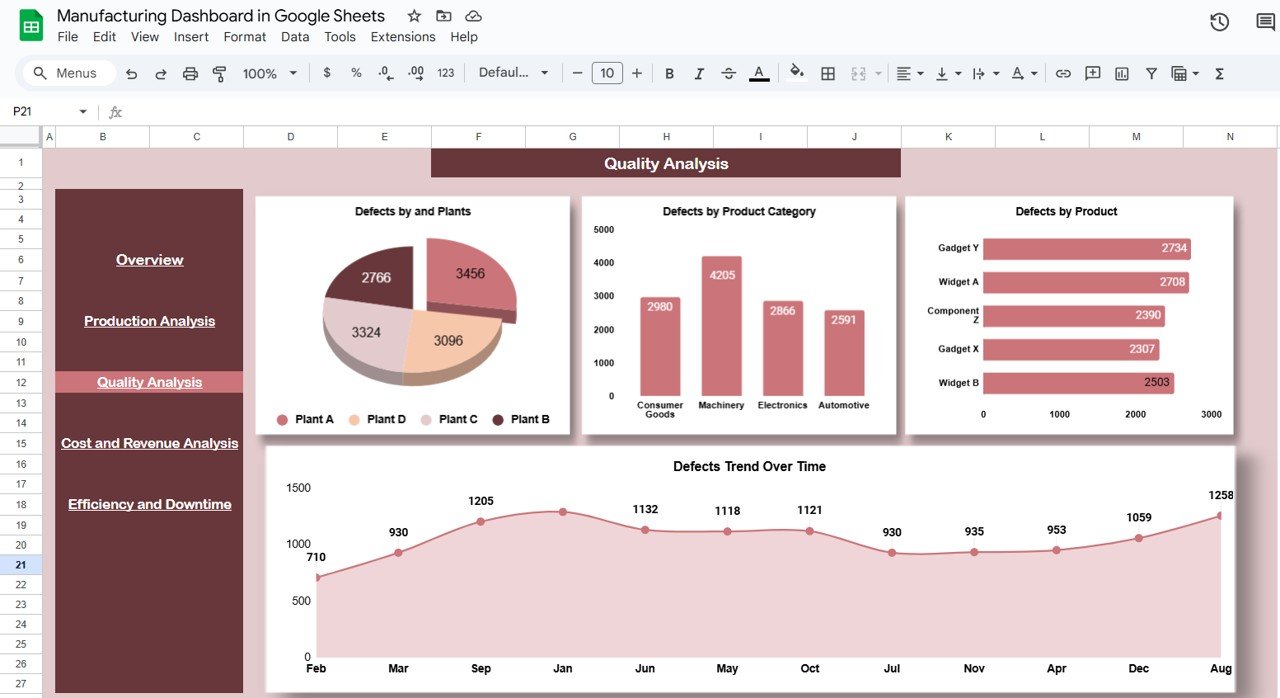
The Quality Analysis Sheet focuses on the quality control aspects of manufacturing. By tracking defects and performance trends, this sheet helps to identify areas where quality improvement is necessary.
Charts in the Quality Analysis Sheet:
-
Defects by Plant: Visualizes the distribution of defects across various plants to highlight areas that need attention.
-
Defects by Product Category: Shows which categories of products have the highest defect rates.
-
Defects by Product: A chart showing defect trends per product to help address specific product-related quality issues.
-
Defects Trend Over Time: Helps track improvements or declines in quality control over time.
Click to buy Manufacturing Dashboard in Google Sheets
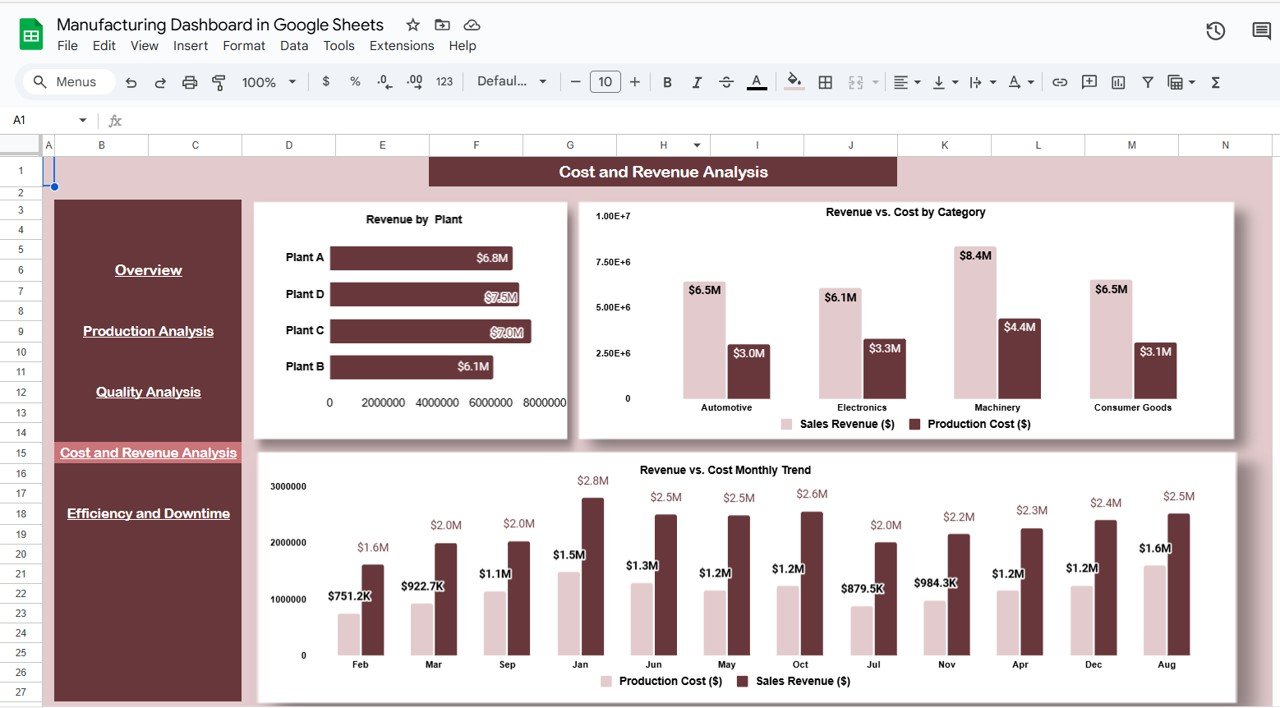
Cost and Revenue Analysis Sheet Tab
The Cost and Revenue Analysis Sheet provides a detailed breakdown of manufacturing costs and revenue. By monitoring these financial metrics, manufacturers can identify opportunities to reduce costs and improve profitability.
Charts in the Cost and Revenue Analysis Sheet:
-
Revenue by Plant: This chart tracks the revenue generated by each plant, helping to pinpoint high and low performers.
-
Revenue vs. Cost by Category: This chart compares revenue against production costs for each category, identifying areas for cost-saving.
-
Revenue vs. Cost Monthly Trend: Helps visualize how revenue and production costs change over time, providing insights into financial performance.
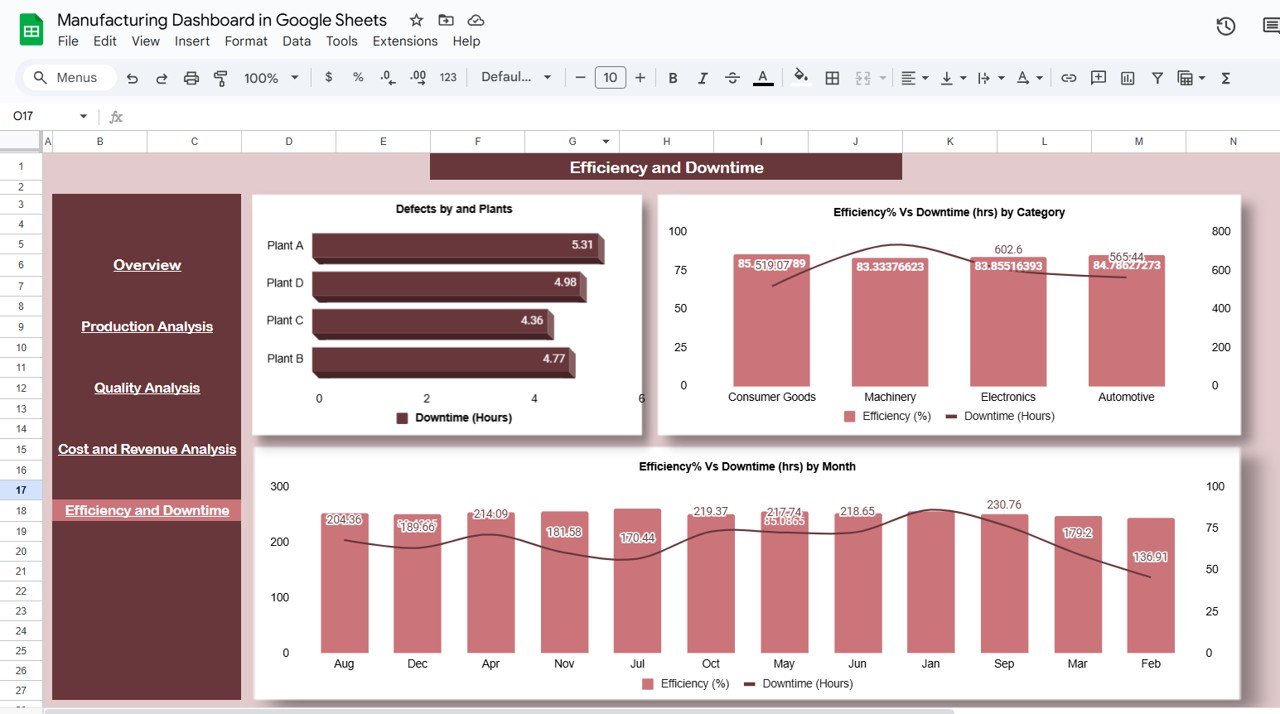
Efficiency and Downtime Sheet Tab
The Efficiency and Downtime Sheet tracks production efficiency and downtime hours. This sheet is crucial for identifying areas where production processes can be optimized to maximize efficiency.
Charts in the Efficiency and Downtime Sheet:
-
Defects by Plant: Shows how defect rates vary across different plants.
-
Efficiency % Vs Downtime (hrs) by Category: Compares efficiency against downtime, helping to evaluate performance across categories.
-
Efficiency % Vs Downtime (hrs) by Month: Tracks the relationship between efficiency and downtime month-over-month.
Click to buy Manufacturing Dashboard in Google Sheets
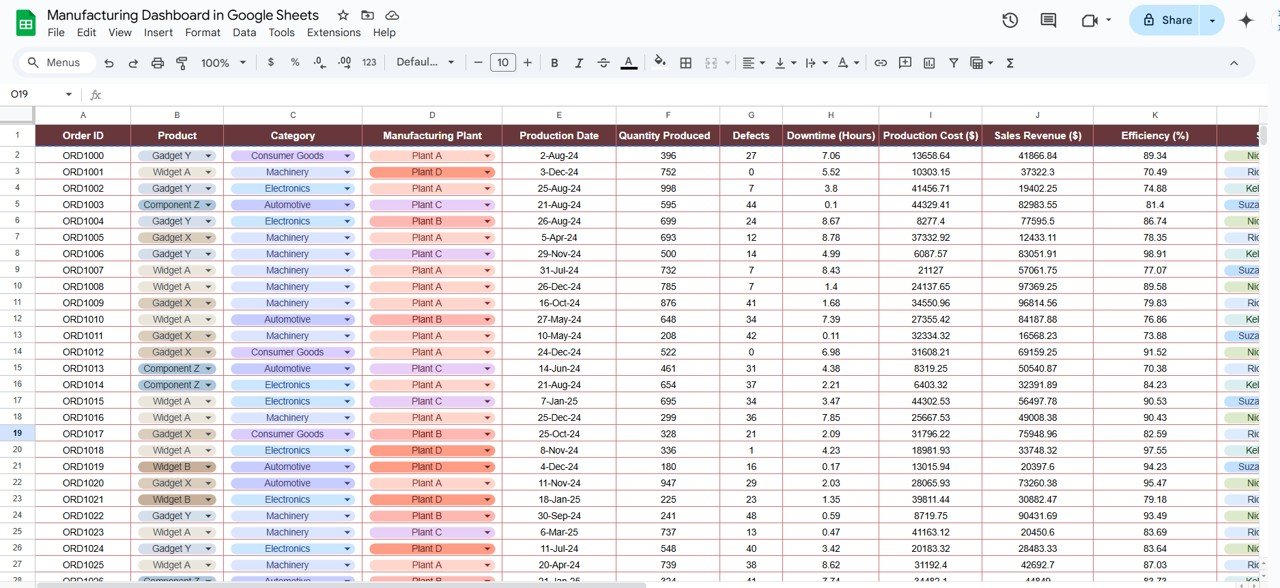
Data Sheet Tab
The Data Sheet serves as the backbone of the manufacturing dashboard. This sheet contains all the raw data that powers the various charts and metrics presented across the other sheets.
Advantages of Using the Manufacturing Dashboard in Google Sheets
-
Real-Time Tracking: The dashboard provides up-to-date insights into key manufacturing metrics.
-
Cost Efficiency: By identifying inefficiencies and tracking production costs, businesses can optimize processes and reduce expenses.
-
Improved Decision Making: With clear visualizations, managers can make informed decisions based on real-time data.
-
Customizable: You can easily adjust the dashboard to fit your specific manufacturing needs and metrics.
-
Accessible: Since it’s built in Google Sheets, it’s accessible from anywhere with an internet connection.
Opportunities for Improvement in Manufacturing Dashboard
Click to buy Manufacturing Dashboard in Google Sheets
While the dashboard is a great tool, there are opportunities for continuous improvement:
-
Integration with ERP Systems: Integrating the dashboard with existing ERP systems can further streamline data collection and reduce manual entry.
-
Enhanced Automation: Adding more automated features such as automatic data entry or alert systems could improve the efficiency of the dashboard.
-
Advanced Data Visualization: Incorporating more advanced visualizations, such as heatmaps or 3D charts, could provide even deeper insights into manufacturing performance.
Best Practices for the Manufacturing Dashboard
-
Update Data Regularly: Ensure that the data sheet is updated regularly to provide the most accurate insights.
-
Leverage Conditional Formatting: Use conditional formatting to quickly identify trends and issues, such as defects or downtime.
-
Customize the Dashboard: Tailor the dashboard’s charts and metrics to reflect your specific manufacturing goals.
-
Monitor KPIs Consistently: Track your key performance indicators regularly to make sure your production stays on track.
-
Use the Dashboard to Identify Patterns: Look for trends over time to spot potential issues before they become larger problems.
Frequently Asked Questions (FAQ)
Click to buy Manufacturing Dashboard in Google Sheets
What is a Manufacturing Dashboard in Google Sheets?
A Manufacturing Dashboard in Google Sheets is a tool that allows manufacturers to track, visualize, and analyze production data in real-time using various charts and metrics. It provides insights into efficiency, production cost, revenue, defects, and more.
How can I use the Manufacturing Dashboard to improve production efficiency?
By tracking key performance metrics like efficiency, downtime, and defects, you can identify areas where production processes are lagging and take corrective actions to improve efficiency.
Can I customize the Manufacturing Dashboard for my plant?
Yes, the dashboard is highly customizable. You can modify the charts, data points, and metrics to fit your specific production needs.
Is the Manufacturing Dashboard suitable for small manufacturers?
Yes, the dashboard is scalable and can be used by manufacturers of all sizes. It’s particularly useful for small manufacturers looking for an easy, cost-effective way to monitor their operations.
How often should I update the data in the Manufacturing Dashboard?
For the best insights, it’s recommended to update the data regularly—daily, weekly, or monthly—depending on the volume and frequency of your production.
Visit our YouTube channel to learn step-by-step video tutorials
Youtube.com/@NeotechNavigators
Watch the step-by-step video Demo: