Managing digital marketing performance across multiple channels can become difficult when data is spread across spreadsheets, ads platforms, analytics tools, and campaign reports. As a result, marketing teams often struggle to track revenue, spend, conversions, impressions, and campaign performance in one place.
Therefore, businesses now prefer interactive dashboards that turn marketing data into clear and actionable insights. One powerful solution is the Marketing Dashboard in HTML.
The Marketing Dashboard in HTML is a modern, interactive, and browser-based analytics solution designed to monitor campaign performance, channel effectiveness, ROI, budget allocation, and detailed marketing records in one centralized system. Because it is built in HTML, it delivers a clean user experience, fast navigation, and professional presentation.
This article explains everything about the Marketing Dashboard in HTML, including its structure, features, advantages, best practices, and frequently asked questions.
What Is a Marketing Dashboard in HTML?
Click to Buy Marketing Dashboard in HTML
A Marketing Dashboard in HTML is an interactive web-based reporting dashboard that helps businesses monitor and analyze marketing performance using KPIs, filters, charts, and data tables.
It brings together key marketing data such as:
- Campaign name
- Channel
- Campaign type
- Campaign manager
- Budget
- Actual spend
- Revenue
- Impressions
- Clicks
- Conversions
- ROI
- CPA
- CTR
- Campaign start and end dates
Because all this information appears in one structured dashboard, users can quickly evaluate performance and make better marketing decisions.
Why Do Businesses Need a Marketing Dashboard?
Modern marketing campaigns run across many platforms such as Google, Facebook, Instagram, LinkedIn, Twitter, YouTube, email, affiliate networks, and SEO channels. However, when teams review each platform separately, decision-making becomes slow and incomplete.
A marketing dashboard solves this problem by providing one source of truth.
Key reasons businesses need it
- Track performance across all channels
- Compare budget vs actual spend
- Measure conversions and revenue
- Monitor campaign ROI
- Identify high-performing managers and campaigns
- Improve reporting speed and clarity
Therefore, businesses can optimize campaigns faster and improve returns.
Key Features of the Marketing Dashboard in HTML
Click to Buy Marketing Dashboard in HTML
The Marketing Dashboard in HTML includes multiple interactive pages and filters that make analysis simple and user-friendly.
1. Top Filter Panel
At the top of the dashboard, users can filter the entire report using:
- Date From
- Date To
- Channel
- Campaign Type
- Campaign Manager
- Year
There is also a Reset button to clear all selected filters quickly.
Because of these controls, users can focus on specific time periods, managers, campaign types, or channels without creating separate reports.
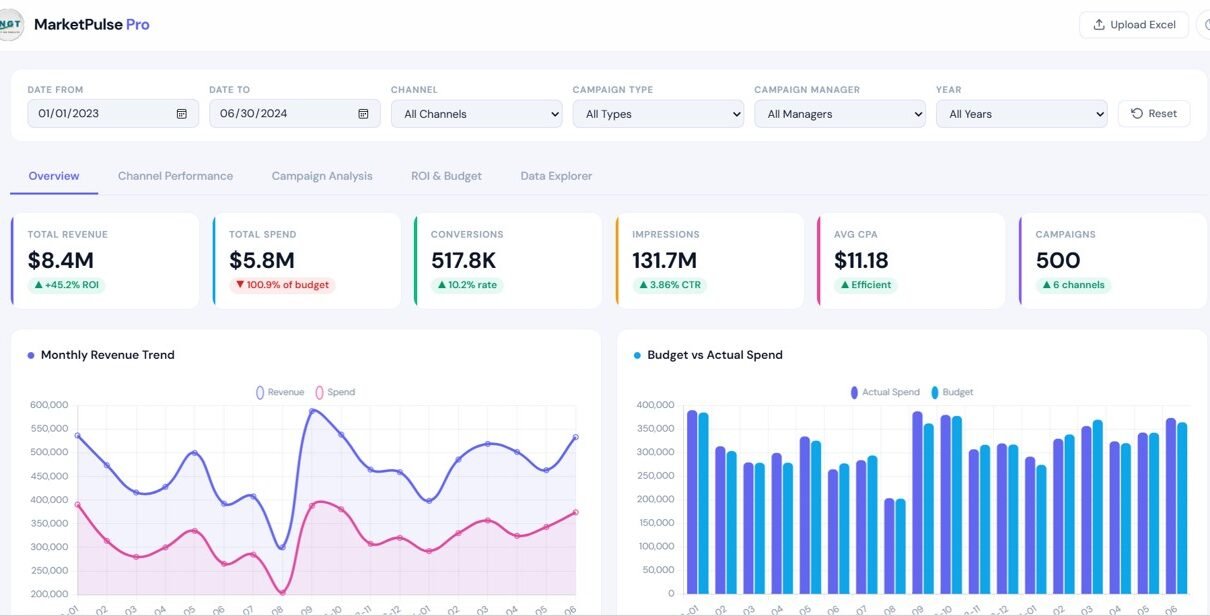
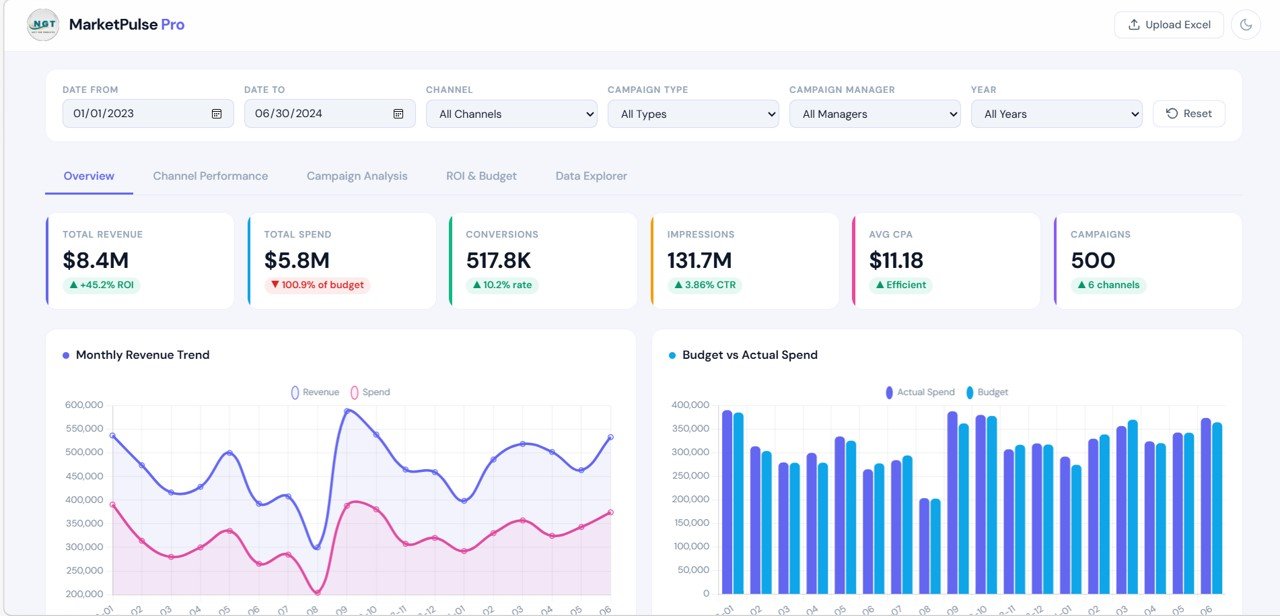
2. Overview Page
The Overview page gives a high-level summary of overall marketing performance.
KPI cards on the Overview page
- Total Revenue
- Total Spend
- Conversions
- Impressions
- Average CPA
- Campaign Count
These KPI cards help users understand the overall state of marketing performance within seconds.
Charts on the Overview page
- Monthly Revenue Trend
- Revenue vs Spend comparison
- Budget vs Actual Spend
- Additional visual trend analysis by time period
Because of these visuals, users can quickly identify whether spend is increasing, revenue is improving, and performance is staying efficient.
Click to Buy Marketing Dashboard in HTML
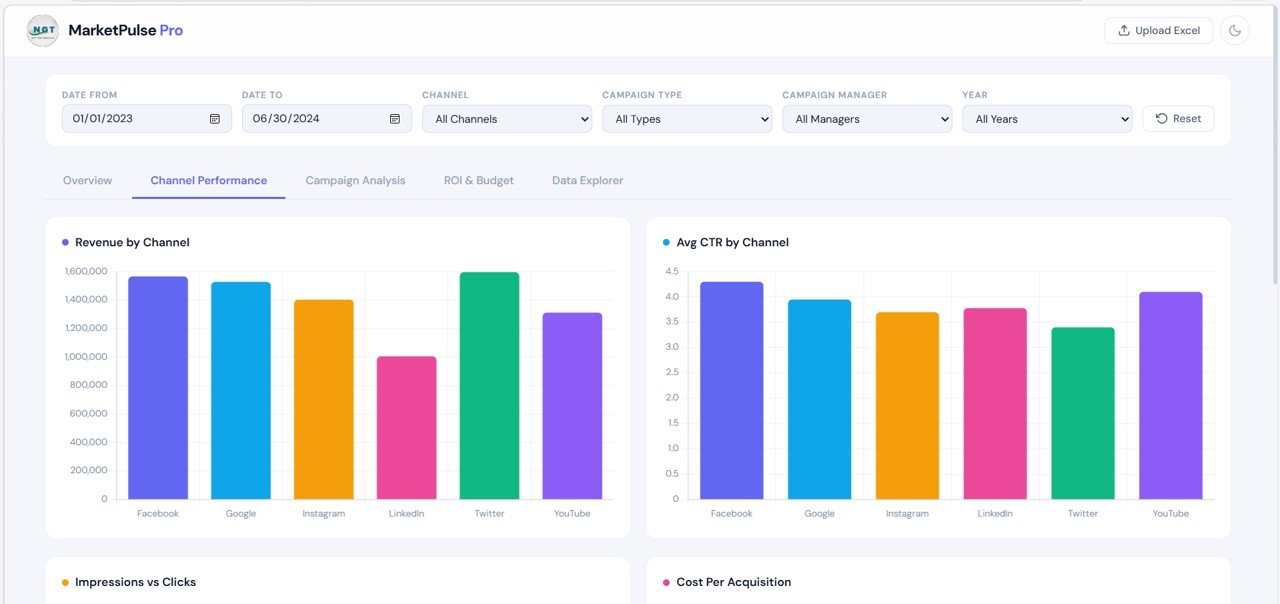
3. Channel Performance Page
The Channel Performance page focuses on how each marketing channel performs.
Charts included
- Revenue by Channel
- Average CTR by Channel
- Impressions vs Clicks
- Cost Per Acquisition by Channel
Insights from this page
This page helps users answer questions such as:
- Which channel generates the most revenue?
- Which channel has the best CTR?
- Which platform delivers lower acquisition cost?
- Which channel needs budget optimization?
Therefore, marketing teams can allocate budget more effectively.
Click to Buy Marketing Dashboard in HTML
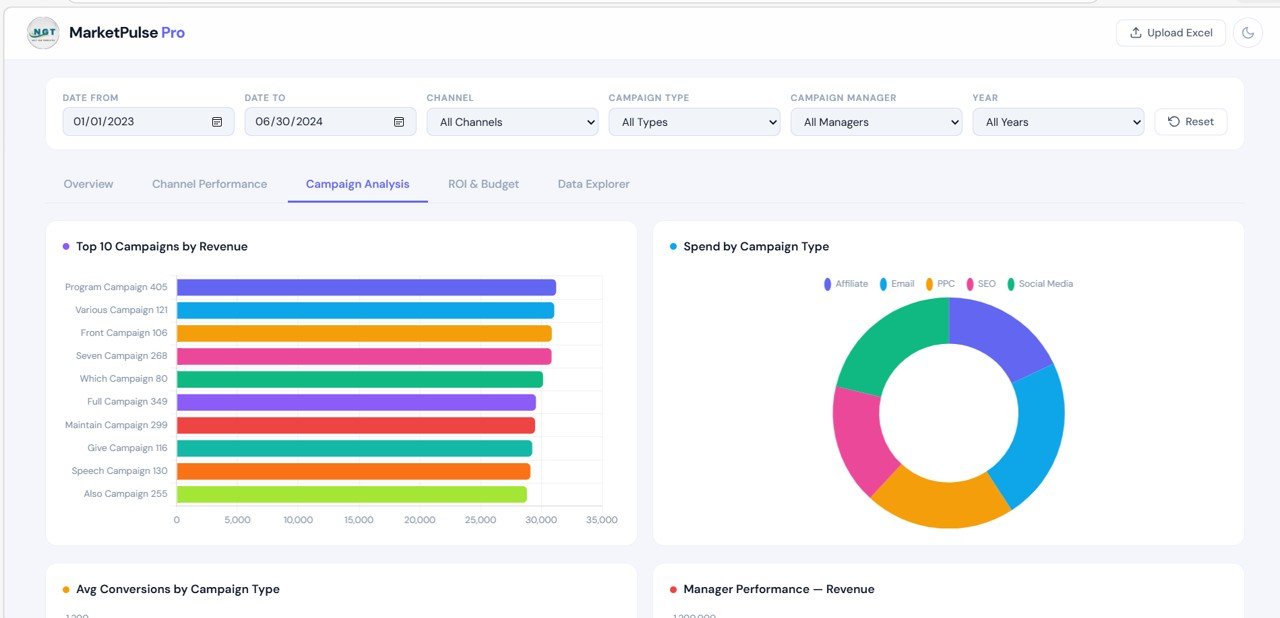
4. Campaign Analysis Page
The Campaign Analysis page helps users evaluate campaign-level performance.
Charts included
- Top 10 Campaigns by Revenue
- Spend by Campaign Type
- Average Conversions by Campaign Type
- Manager Performance by Revenue
Insights provided
This page helps businesses identify:
- Best-performing campaigns
- Campaign types with the highest spend
- Campaign categories producing better conversions
- Managers driving the strongest revenue results
As a result, teams can replicate successful campaign strategies.
Click to Buy Marketing Dashboard in HTML
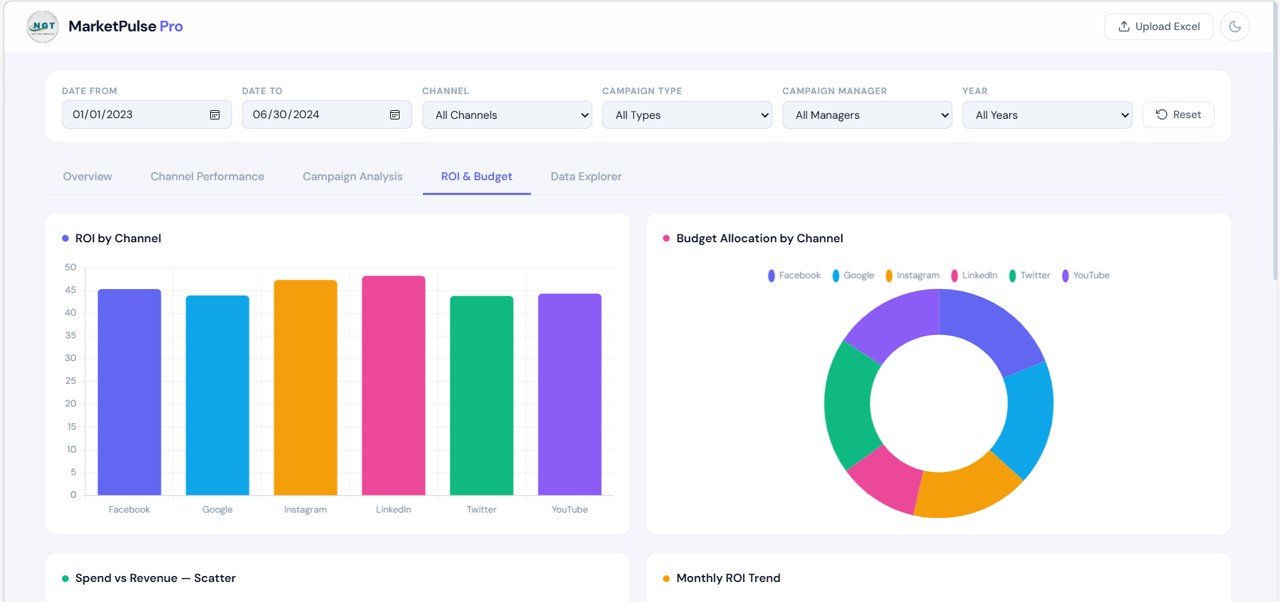
5. ROI & Budget Page
The ROI & Budget page focuses on profitability and spending efficiency.
Charts included
- ROI by Channel
- Budget Allocation by Channel
- Spend vs Revenue Scatter
- Monthly ROI Trend
Insights from this page
Users can analyze:
- Which channel delivers the best ROI
- Whether budget allocation matches performance
- Which campaigns overspend without strong returns
- How ROI changes over time
Therefore, decision-makers can improve marketing profitability with confidence.
Click to Buy Marketing Dashboard in HTML
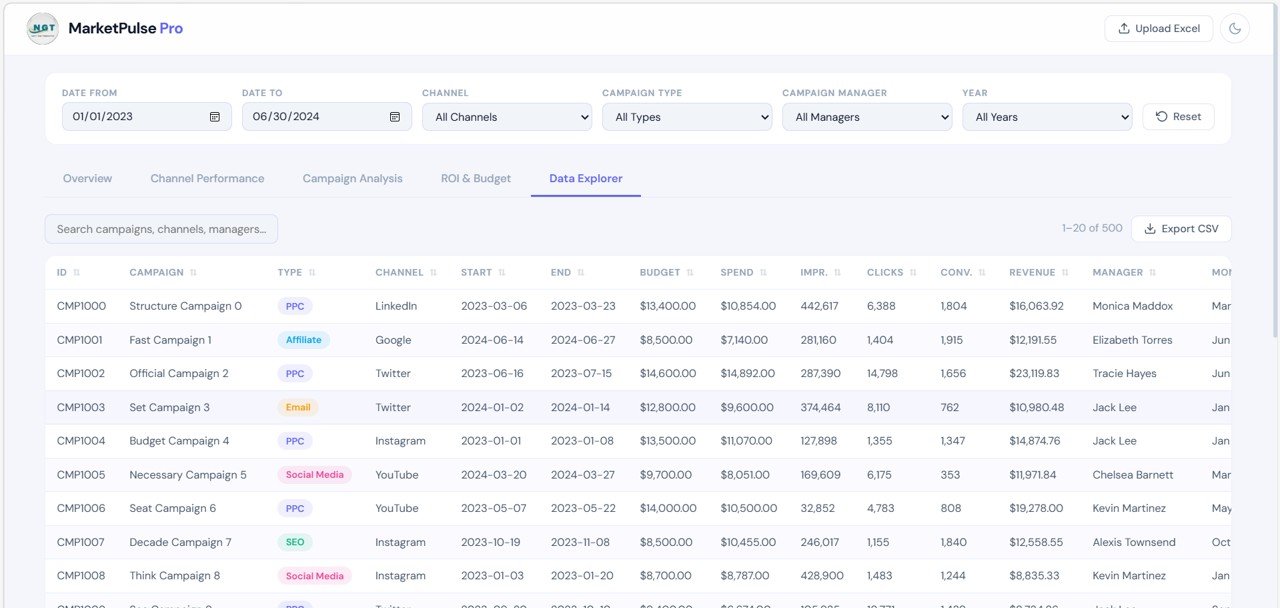
6. Data Explorer Page
The Data Explorer page provides a detailed campaign-level table.
Features available
- Search box for quick record lookup
- Export CSV option
- Campaign listing with multiple fields
- Scrollable, structured table format
Typical columns included
- ID
- Campaign
- Type
- Channel
- Start Date
- End Date
- Budget
- Spend
- Impressions
- Clicks
- Conversions
- Revenue
- Manager
- Month
Because of this page, users can move from high-level summary to detailed record analysis instantly.
Click to Buy Marketing Dashboard in HTML
What Makes This HTML Dashboard Powerful?
The Marketing Dashboard in HTML stands out because it combines professional design with flexible reporting.
Core strengths
- Clean and modern browser-based interface
- Interactive filters across all tabs
- Multiple analytical pages
- Visual KPI cards for quick decision-making
- Detailed campaign explorer for record-level review
- Easy presentation to clients or management
Therefore, it works well for both internal marketing teams and agencies.
Advantages of the Marketing Dashboard in HTML
Using this dashboard provides many practical benefits.
1. Centralized marketing reporting
All important campaign data appears in one place. As a result, users no longer need to switch between multiple systems.
2. Better campaign optimization
Users can quickly identify top channels, winning campaigns, and underperforming spend areas. Therefore, optimization becomes faster.
3. Improved budget control
The dashboard compares budget and spend visually. Consequently, teams can prevent overspending.
4. Faster decision-making
KPI cards and interactive charts reduce the time needed for manual analysis.
5. Professional presentation
Because the dashboard uses a sleek HTML layout, it looks modern and client-ready.
6. Easy data exploration
The built-in table and search option make detailed campaign review simple.
Best Practices for the Marketing Dashboard in HTML
To get the best results, users should follow these best practices.
1. Keep campaign data clean
Use consistent campaign names, channel labels, and manager names. This improves reporting quality.
2. Update data regularly
Frequent updates keep the dashboard reliable and useful for decision-making.
3. Monitor both revenue and efficiency
Do not focus only on spend or impressions. Instead, review ROI, CPA, CTR, and conversions together.
4. Compare channels carefully
Some channels drive awareness, while others drive direct conversions. Therefore, compare them using the right goals.
5. Use filters before making conclusions
Apply filters for time range, channel, and campaign type so that your analysis remains focused.
6. Review detailed records in Data Explorer
Always use the detailed table when investigating unusual performance.
Why Choose HTML for a Marketing Dashboard?
HTML dashboards offer several strong benefits compared to static reports.
Benefits of HTML dashboards
- Accessible from a browser
- Modern and professional appearance
- Smooth navigation between tabs
- Better interactivity
- Easy sharing in demos and presentations
- Flexible structure for future upgrades
Because of these benefits, HTML dashboards are ideal for businesses that want attractive and practical reporting tools.
Conclusion
Click to Buy Marketing Dashboard in HTML
Marketing success depends on tracking the right metrics at the right time. However, when campaign data remains scattered, businesses struggle to measure true performance.
The Marketing Dashboard in HTML solves this problem by combining KPIs, filters, charts, and detailed campaign records in one powerful interface. Because it includes pages like Overview, Channel Performance, Campaign Analysis, ROI & Budget, and Data Explorer, users can move from summary insights to detailed analysis easily.
Moreover, the dashboard provides a clean, modern, and professional design that makes reporting easier and more effective. Therefore, if you want to improve campaign monitoring, control budgets, and optimize marketing performance, the Marketing Dashboard in HTML is an excellent solution.
Visit our YouTube channel to learn step-by-step video tutorials
Youtube.com/@NeotechNavigators
Watch the step-by-step video tutorial: