In the fast-paced world of marketing, tracking key performance indicators (KPIs) is essential for understanding the effectiveness of your strategies. The Marketing KPI Dashboard in Google Sheets provides a powerful yet simple way to manage and monitor these important metrics. This dashboard template is ready to use and comes with all the necessary features for tracking your marketing performance.
In this article, we will walk you through everything you need to know about this Marketing KPI Dashboard, including its key features, advantages, and how you can utilize it for better decision-making. We will also list all the KPIs, their units, formulas to aggregate them, and whether higher or lower values are preferable.
What is a Marketing KPI Dashboard?
A Marketing KPI Dashboard is a visual tool used to track and measure the performance of various marketing efforts. It presents the data in an easy-to-read format, helping marketers understand what strategies are working and which areas need improvement.
With the use of Google Sheets, marketers can access a customizable, shareable dashboard that provides an overview of important KPIs like customer acquisition cost, conversion rates, and revenue. This dashboard makes tracking marketing campaigns more efficient and provides insights that guide future decisions.
Key Features of the Marketing KPI Dashboard in Google Sheets
Click to buy Marketing KPI Dashboard in Google Sheets
This template consists of six distinct worksheets, each serving a different function. Let’s explore them:
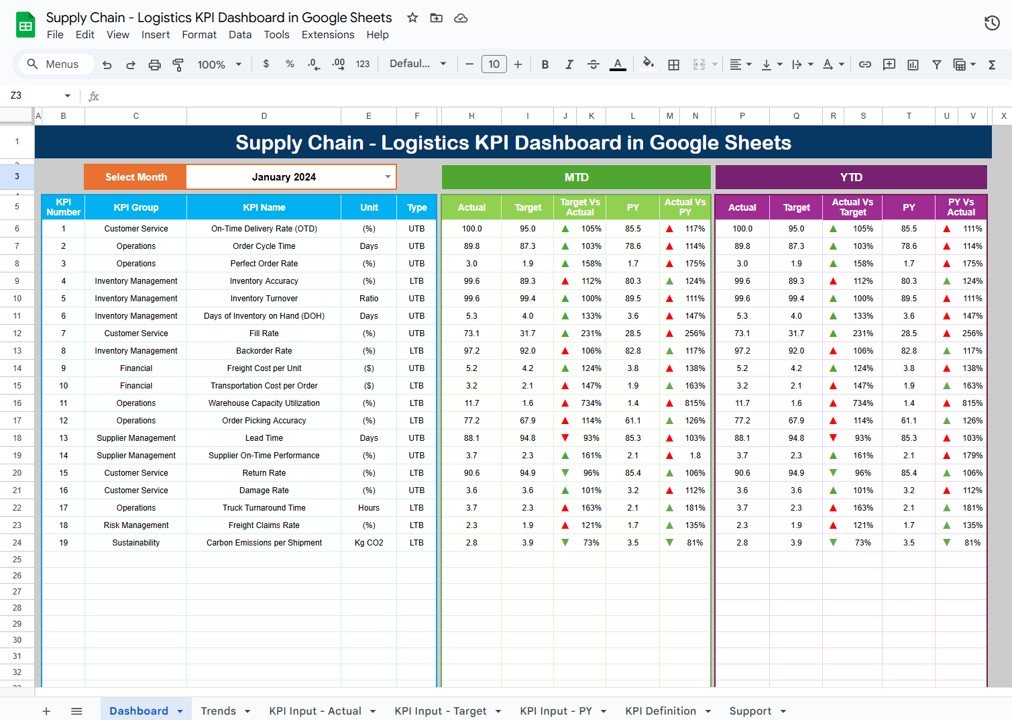
1. Dashboard Sheet Tab:
This is the main tab where you will see an overview of all your KPIs.
Functionality: On range D3, you can select the month from a drop-down menu, and the data will update accordingly for the chosen month.
Displayed Metrics: This tab includes:
- MTD (Month-to-Date) Actual, Target, and Previous Year data.
- YTD (Year-to-Date) Actual, Target, and Previous Year data.
- Target vs Actual and Previous Year vs Actual comparisons.
Visuals: Conditional formatting in the form of up or down arrows provides quick visual cues on performance.

Click to buy Marketing KPI Dashboard in Google Sheets
2. KPI Trend Sheet Tab:
This sheet allows you to track and compare the performance of each KPI over time.
Functionality: You can select the KPI name from a drop-down menu (Range C3). It displays:
- The KPI group, unit, type (whether “Lower the better” or “Upper the better”).
- The formula for calculating the KPI.
- The definition of the KPI.

Click to buy Marketing KPI Dashboard in Google Sheets
3. Actual Numbers Sheet Tab:
-
This tab is used for entering actual numbers related to your marketing KPIs.
-
Functionality: For each month, you enter the actual data for MTD and YTD.
-
Customization: You can easily change the month from Range E1 to update the data for a particular month.

Click to buy Marketing KPI Dashboard in Google Sheets
4. Target Sheet Tab:
-
Here, you can input the target numbers for each KPI for the current month (MTD) and the entire year (YTD).
-
Purpose: This tab ensures you compare actual performance with the targets you have set.

Click to buy Marketing KPI Dashboard in Google Sheets
5. Previous Year Numbers Sheet Tab:
-
This sheet allows you to enter the data for the previous year for comparison.
-
Usage: You can compare this year’s KPIs against the same period from the previous year to measure progress or identify trends.

Click to buy Marketing KPI Dashboard in Google Sheets
6. KPI Definition Sheet Tab:
This sheet defines each KPI included in the dashboard.
Data Fields: For each KPI, you can enter the following:
- Name of the KPI.
- KPI Group.
- Unit of measurement.
- Formula for calculation.
- Definition and purpose of the KPI.

Click to buy Marketing KPI Dashboard in Google Sheets
Advantages of Using a Marketing KPI Dashboard in Google Sheets
Implementing a Marketing KPI Dashboard in Google Sheets brings numerous benefits to marketing teams. Here are some of the top advantages:
- Centralized Data Management: This dashboard consolidates all your marketing KPIs in one place, making it easier to track and manage the data. You don’t have to rely on multiple platforms or tools; everything is in Google Sheets, easily accessible.
- Real-Time Update: By integrating real-time data input for both actual and target values, the dashboard ensures that your marketing team can make informed decisions based on the most up-to-date information.
- Customizability: The dashboard is highly customizable. You can adjust the KPIs, change formulas, and modify the design to match your marketing goals and strategies.
- Improved Decision-Making: With all KPIs displayed clearly, it’s easier to spot trends, measure performance, and identify areas that require improvement. This leads to more effective and data-driven decision-making.
- Ease of Sharing and Collaboration: Google Sheets makes it easy to share the dashboard with your team or stakeholders. Multiple people can access and edit the file, ensuring seamless collaboration.
Opportunities for Improvement in the Marketing KPI Dashboard
Click to buy Marketing KPI Dashboard in Google Sheets
While the Marketing KPI Dashboard in Google Sheets is a robust tool, there’s always room for improvement. Here are some potential areas for enhancement:
- Automation of Data Collection: Currently, the dashboard relies on manual data input. Integrating automated data collection from other platforms, such as Google Analytics, social media, or CRM systems, could save time and reduce human error.
- Advanced Data Visualizations: While conditional formatting provides basic visual cues, adding more advanced charts and graphs could enhance the dashboard’s usability and make it easier to interpret data at a glance.
- Performance Alerts: Setting up automated alerts to notify you when certain KPIs go above or below a certain threshold could help keep your team proactive and prevent potential issues from being overlooked.
- Integration with Other Tools: The dashboard could be improved by integrating it with other project management or marketing tools like Trello, HubSpot, or Mailchimp, providing a more holistic view of your marketing performance.
Best Practices for Using the Marketing KPI Dashboard in Google Sheets
Click to buy Marketing KPI Dashboard in Google Sheets
To get the most out of the Marketing KPI Dashboard, follow these best practices:
- Set Clear Marketing Goals: Define your marketing objectives clearly before implementing the dashboard. This will help ensure you are tracking the right KPIs and that the data is meaningful.
- Regularly Update the Dashboard: Keep the data current by updating it regularly. This is crucial to ensure the information is relevant and timely, enabling your team to make quick, informed decisions.
- Focus on Actionable KPIs: Not all KPIs are equally important. Focus on the metrics that directly impact your marketing strategy and business goals. This will help your team prioritize efforts on areas that drive results.
- Use Conditional Formatting Effectively: Take full advantage of conditional formatting to highlight performance trends. Use colors, arrows, or icons to easily spot KPIs that are performing well or need attention.
- Share and Collaborate: Make sure the dashboard is shared with all stakeholders and team members. Encourage collaboration to ensure everyone is aligned and informed on marketing performance.
Frequently Asked Questions (FAQs)
Click to buy Marketing KPI Dashboard in Google Sheets
What is a KPI in marketing?
A KPI (Key Performance Indicator) in marketing is a measurable value that shows how effectively a company is achieving its marketing objectives.
Why is the Marketing KPI Dashboard in Google Sheets beneficial?
It provides a centralized, customizable platform for tracking and analyzing marketing performance in real-time, allowing teams to make data-driven decisions.
How can I customize the Marketing KPI Dashboard?
You can customize the KPIs, input targets, and adjust formulas based on your specific marketing needs and strategies.
What is the difference between MTD and YTD data?
MTD (Month-to-Date) refers to performance data for the current month, while YTD (Year-to-Date) includes data from the beginning of the year up to the current date.
Can I automate the data entry in this dashboard?
Currently, the dashboard requires manual data entry, but you can automate data collection by integrating it with other marketing tools like Google Analytics.
Conclusion
Click to buy Marketing KPI Dashboard in Google Sheets
A Marketing KPI Dashboard in Google Sheets is an invaluable tool for marketing teams, providing real-time insights into campaign performance and business results. By tracking important KPIs and using the dashboard to analyze trends and make informed decisions, you can optimize your marketing efforts and achieve your business goals more efficiently. Follow the best practices and continuously improve the dashboard to keep up with changing market dynamics, and your team will be empowered to make better, data-driven decisions.
Visit our YouTube channel to learn step-by-step video tutorials
Youtube.com/@NeotechNavigators