Marketing is the engine that drives business growth, and tracking marketing performance effectively helps teams focus on strategies that deliver measurable results. The Marketing KPI Scorecard in Google Sheets is a ready-to-use, automated tool designed to help marketing teams visualize, measure, and improve their performance with real-time data.
In this article, we’ll walk through the structure, features, KPI examples (with unit, formula, and type), advantages, opportunities for improvement, best practices, and frequently asked questions — so you can use this scorecard effectively.
What Is a Marketing KPI Scorecard in Google Sheets?
Click to Buy Marketing KPI Scorecard in Google Sheets
A Marketing KPI Scorecard is a performance management tool that tracks key marketing metrics — from campaign reach and conversion rates to ROI and lead quality.
Built in Google Sheets, it provides an interactive and dynamic layout that automatically updates visuals, metrics, and indicators when you change the month or data. With just one template, you can evaluate both Month-To-Date (MTD) and Year-To-Date (YTD) marketing performance.
This scorecard helps marketing managers and executives make informed decisions, align strategy with goals, and improve ROI.
Scorecard Sheet Tab Overview
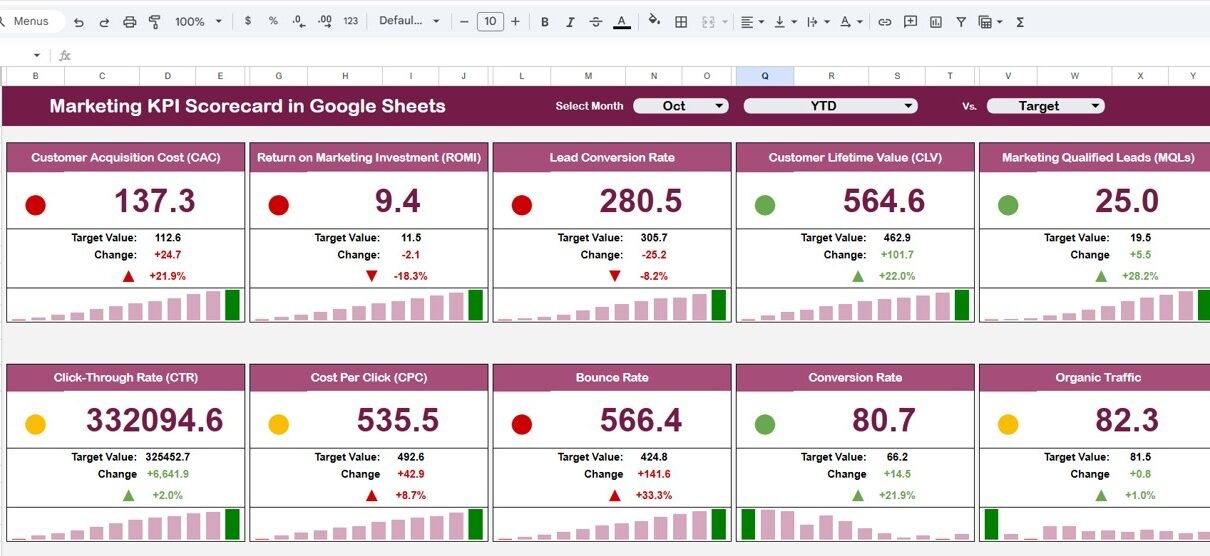
The Scorecard Sheet Tab is the main dashboard — a visual and interactive page that summarizes all marketing KPIs in one place.
🎯 Key Features
Month Dropdown (Cell D3):
Select any month, and all KPIs update automatically for that period.
MTD and YTD Toggle Buttons:
- MTD (Month-To-Date): View current month’s data.
- YTD (Year-To-Date): View cumulative data for the entire year.
Traffic Light Indicators:
Each KPI features a color-coded status:
- 🟢 Green: Target achieved or exceeded
- 🟡 Yellow: Slightly below target
- 🔴 Red: Below expected performance
Up/Down Arrows:
Performance changes are visually represented with up (⬆️) or down (⬇️) arrows, indicating growth or decline compared to previous periods.
This makes it simple to understand marketing performance at a glance.

Click to Buy Marketing KPI Scorecard in Google Sheets
KPI Trend Sheet Tab
The KPI Trend Sheet Tab provides an in-depth look at how each KPI evolves over time.
Dropdown in Cell C3: Select a KPI to view its historical trend.
Displayed Fields:
- KPI Group
- Unit of Measurement
- Type (LTB – Lower the Better, UTB – Upper the Better)
- Formula
- Definition
This tab helps marketers analyze seasonal trends, identify best-performing campaigns, and make data-driven adjustments.

Data Input Sheet Tab
The Data Input Sheet Tab is where you enter your raw data — including monthly values for Actuals and Targets.
Data Columns Typically Include:
-
Month
-
KPI Name
-
MTD Actual
-
MTD Target
-
YTD Actual
-
YTD Target
-
Previous Year Values (for comparison)
Once the data is entered, the scorecard and charts automatically refresh to display updated results.

Click to Buy Marketing KPI Scorecard in Google Sheets
🧮 KPI Definition Sheet Tab
The KPI Definition Sheet Tab lists all KPIs with their respective formulas, units, and performance types (UTB/LTB). This ensures everyone in the marketing team measures success consistently.

Advantages of the Marketing KPI Scorecard in Google Sheets
-
Real-Time Insights: Instantly track campaign performance with auto-updating visuals.
-
Centralized Performance Data: View all key marketing metrics in one place.
-
Customizable Framework: Easily add or modify KPIs to match your marketing goals.
-
Interactive Visuals: Traffic lights, arrows, and percentage changes simplify data interpretation.
-
Team Collaboration: Share and update the sheet across departments in real time.
-
Trend Analysis: Identify strengths and weaknesses over time.
-
Cost-Effective: No need for complex BI tools — everything runs in Google Sheets.
Opportunities for Improvement
Click to Buy Marketing KPI Scorecard in Google Sheets
While this dashboard is robust, it can be enhanced further:
-
Automation: Integrate with Google Analytics or Ads for live data import.
-
Campaign Tracking Sheet: Add a tab for campaign-wise performance.
-
Email Notifications: Trigger alerts when KPIs fall below target.
-
Forecasting Tools: Add formulas to project future KPI trends.
-
Visualization Enhancement: Connect to Looker Studio for advanced dashboards.
Best Practices for Using the Scorecard
-
Update Data Monthly: Ensure the Data Input sheet stays current.
-
Define Clear Targets: Set realistic benchmarks for each KPI.
-
Regular Review: Conduct monthly KPI review meetings.
-
Use Consistent Units: Keep metrics standardized for accuracy.
-
Protect Key Formulas: Restrict edits to prevent data loss.
-
Train Teams: Help marketing staff understand KPI significance and actions.
Conclusion
Click to Buy Marketing KPI Scorecard in Google Sheets
The Marketing KPI Scorecard in Google Sheets is an essential tool for any marketing department looking to monitor and improve its performance. It provides a clear view of critical KPIs like conversion rate, ROI, and engagement — all in one automated and easy-to-use dashboard.
With visual indicators, trend tracking, and customizable metrics, this scorecard empowers marketing teams to focus on data-driven success, optimize budgets, and continuously enhance campaign outcomes.
Frequently Asked Questions (FAQ)
Click to Buy Marketing KPI Scorecard in Google Sheets
1. Can I add more KPIs to the scorecard?
Yes. Simply update the KPI Definition and Data Input sheets to include new metrics.
2. Can this scorecard connect to Google Analytics or Ads?
Yes. You can use Google Apps Script or third-party connectors for automated data import.
3. How do I interpret the traffic light indicators?
Green = Good, Yellow = Needs Attention, Red = Poor performance.
4. Can I view both monthly and annual results?
Yes. Use MTD/YTD toggles to switch between views.
5. Is it suitable for both digital and traditional marketing teams?
Absolutely. The KPIs are flexible and cover both online and offline marketing efforts.
Visit our YouTube channel to learn step-by-step video tutorials