Google Sheets has an abundance of functions that can simplify calculations, and one of the most commonly used is the AVERAGE Function in Google Sheets. Whether you’re a student, teacher, or a professional dealing with numbers, learning how to calculate the average can help you analyze data faster and more accurately. Today, we’ll dive deep into how to use the AVERAGE function in Google Sheets, complete with an example to guide you along the way.
What is the AVERAGE Function?
In simple terms, the AVERAGE function helps you find the mean (or average) of a group of numbers. Instead of manually adding up all the values and dividing by the total number of items, Google Sheets allows you to calculate the average in just a few clicks. Let’s take a closer look at how it works, especially with an example dataset.
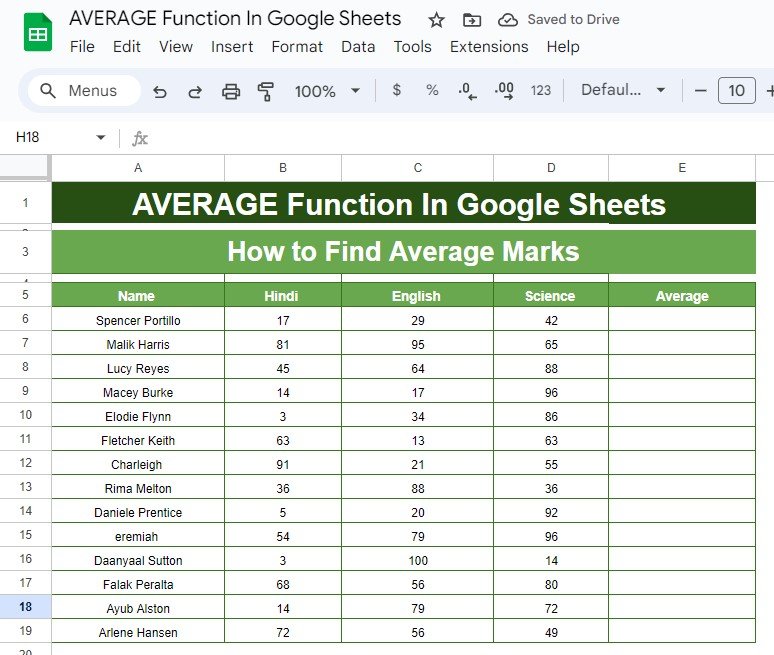
Understanding Our Example Data
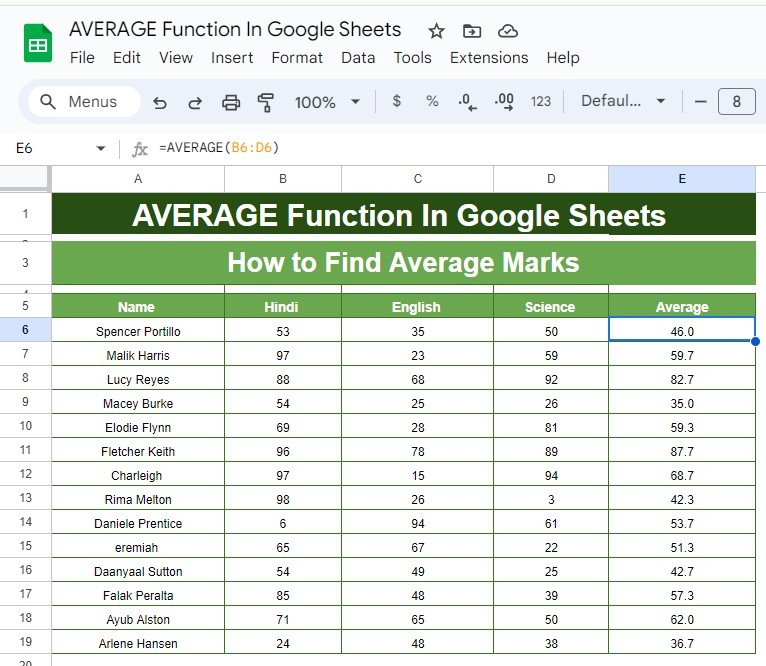
Before jumping into the formula, let’s break down the data we’ll be working with. Imagine you have a table of students with their scores in three subjects: Hindi, English, and Science. We’re looking to calculate the average score across these subjects for each student.
We want to calculate the average score for each student across all three subjects. How do we do that?
How to Use the AVERAGE Function in Google Sheets
Using the AVERAGE function is incredibly straightforward. The syntax is:
=AVERAGE(range)
In this example, we want to find the average score for each student. To calculate the average for the first student, Spencer Portillo, across the three subjects (Hindi, English, and Science), you would enter the following formula in the cell next to his name:
=AVERAGE(B2:D2)
Let’s break this down:
refers to the range of cells that contain Spencer’s scores.
The AVERAGE function will sum up the values in these cells and divide the total by 3 (since there are three subjects) to give the average score.
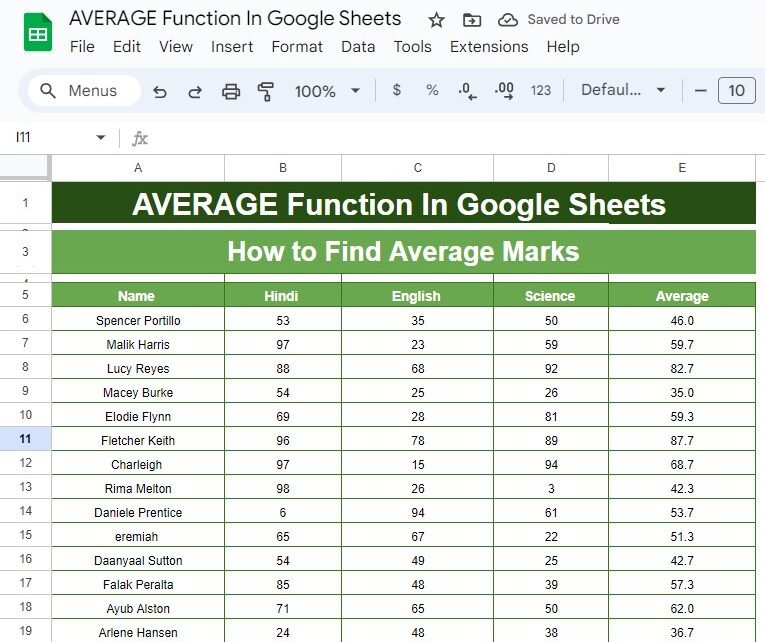
Output of the AVERAGE Function
Once you apply the formula across all rows, here’s what your data might look like:
As you can see, the AVERAGE function provides a clear summary of each student’s performance across the three subjects. Instead of analyzing each score individually, you can now focus on their average, making it much easier to compare students.
Common Mistakes to Avoid
While using the AVERAGE function is simple, there are a few things to watch out for:
- Empty Cells: If any cell in the range is blank, the AVERAGE function will still include it in its calculation. So, make sure all cells contain valid numbers.
- Text in Cells: If your data range contains text or non-numerical values, Google Sheets will ignore these when calculating the average.
- Large Ranges: Ensure that your range only includes the cells you need. Accidentally including extra cells or entire columns can skew your results.
Why Use the AVERAGE Function?
Now that you’ve learned how to apply the AVERAGE function, let’s briefly talk about why it’s so useful:
- Saves Time: No need to manually calculate the average.
- Reduces Errors: Since Google Sheets handles the calculation, the risk of human error is greatly minimized.
- Versatile: You can use the AVERAGE function for various types of data, from student scores to financial figures.
Conclusion
And there you have it! You’ve just learned how to use the AVERAGE function in Google Sheets with a practical example. Whether you’re a beginner or someone looking to refine your Google Sheets skills, mastering this function will make your data analysis quicker and more efficient.
Visit our YouTube channel to learn step-by-step video tutorials
Youtube.com/@NeotechNavigators
View this post on Instagram