Running a meal prep business can be exciting, rewarding, and challenging — all at once. From managing daily orders and customer preferences to controlling food costs and delivery efficiency, there are countless metrics to monitor. Without the right tools, keeping track of these numbers can become a full-time job.
That’s why the Meal Prep Business KPI Dashboard in Google Sheets is a game-changer. This smart, data-driven solution helps entrepreneurs, managers, and kitchen teams easily monitor key performance indicators (KPIs) that define success in the meal prep industry.
In this detailed article, you’ll learn everything about this Google Sheets-based dashboard — how it works, its key features, advantages, best practices, and frequently asked questions. Let’s dive in.
Click to buy Meal Prep Business KPI Dashboard in Google Sheets
What Is a Meal Prep Business KPI Dashboard in Google Sheets?
A Meal Prep Business KPI Dashboard in Google Sheets is a ready-to-use performance management tool designed to help meal prep companies measure business success. It consolidates your essential metrics — from customer acquisition to food waste — into a single, interactive dashboard.
Since it’s built in Google Sheets, it’s cloud-based, collaborative, and easy to customize. You don’t need any special software or coding experience — just your browser and an internet connection.
The dashboard lets you:
- Track monthly and yearly progress.
- Compare actuals with targets and previous year data.
- Visualize performance trends using charts and color indicators.
- Make quick, data-driven decisions to improve efficiency and profitability.
Structure of the Meal Prep Business KPI Dashboard in Google Sheets
This comprehensive KPI dashboard includes six interconnected worksheets, each designed for a specific purpose. Let’s explore each one in detail.
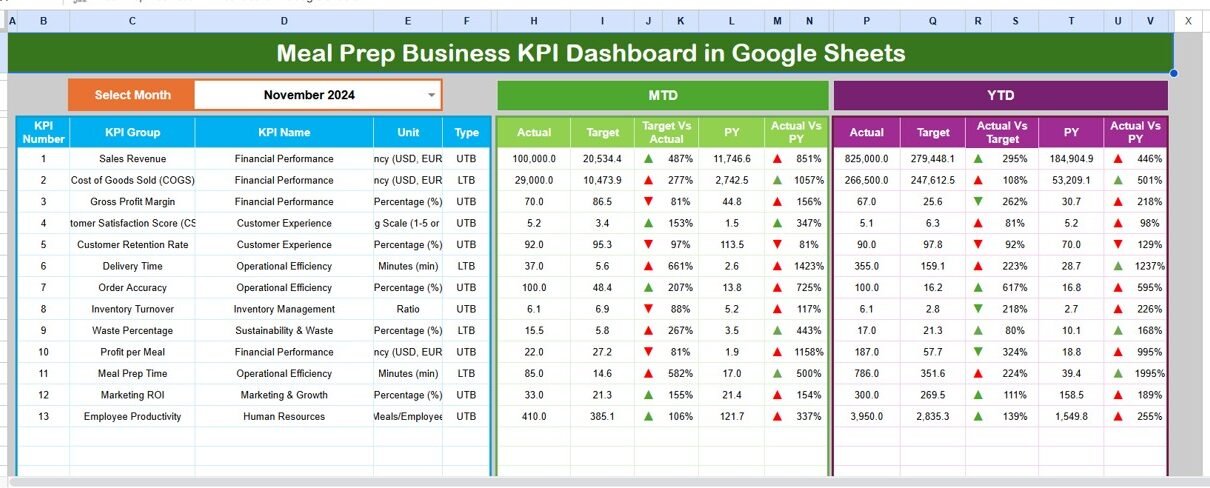
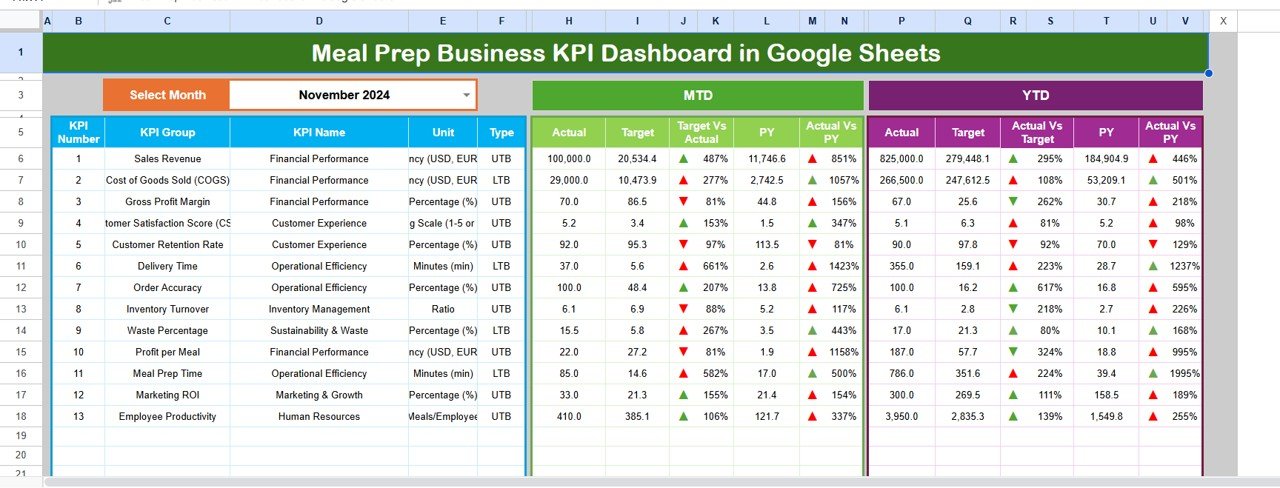
Dashboard Sheet Tab – The Main Control Center
The Dashboard sheet is where everything comes together. It presents a complete overview of your business performance for any selected month.
- Month Selection: Choose the desired month from a drop-down list in cell D3. The dashboard automatically refreshes all figures based on your selection.
- MTD and YTD Performance: Instantly view Month-to-Date (MTD) and Year-to-Date (YTD) data for Actuals, Targets, and Previous Year (PY).
- Comparative Analysis: The dashboard uses conditional formatting arrows to highlight whether your metrics are improving or declining — a simple but powerful visual cue.
- Target vs. Actual Tracking: Quickly identify which KPIs are meeting goals and which need attention.
- PY vs. Actual Comparison: Monitor long-term growth by comparing this year’s results with last year’s performance.
This sheet transforms raw numbers into clear, actionable visuals — giving you instant business clarity.
Click to buy Meal Prep Business KPI Dashboard in Google Sheets
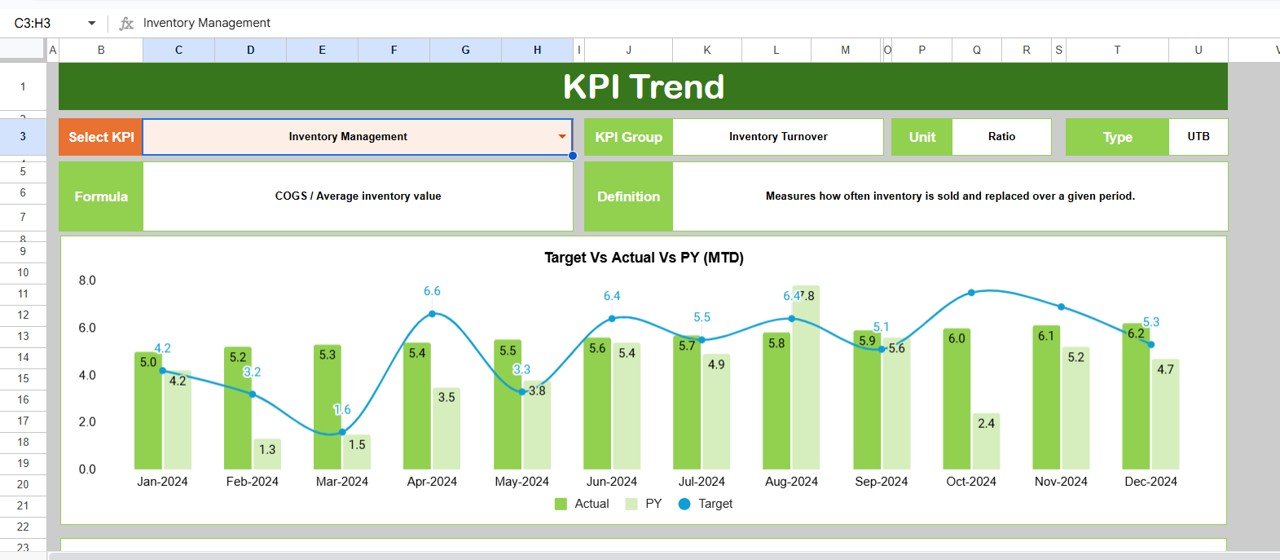
Trend Sheet Tab – Analyze KPI Performance Over Time
The Trend sheet allows deeper analysis for each KPI. It’s the best place to explore how a particular metric evolves month after month.
- Dynamic KPI Selection: Select a KPI from the drop-down list in cell C3 to view its details.
- Displayed Information: The sheet shows KPI Group, Unit, Type (Upper the Better or Lower the Better), Formula, and Definition.
- Visual Trends: Interactive charts display MTD and YTD trends for Actual, Target, and PY numbers.
- Comparative Insights: Identify seasonal patterns or performance dips to make proactive adjustments.
This sheet turns your data into meaningful stories — helping you discover trends that spreadsheets alone might hide.
Click to buy Meal Prep Business KPI Dashboard in Google Sheets
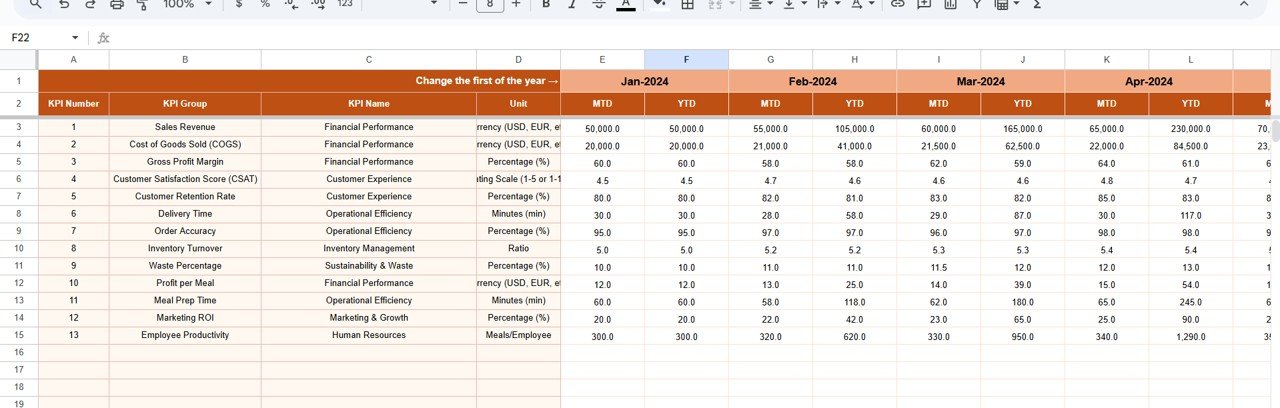
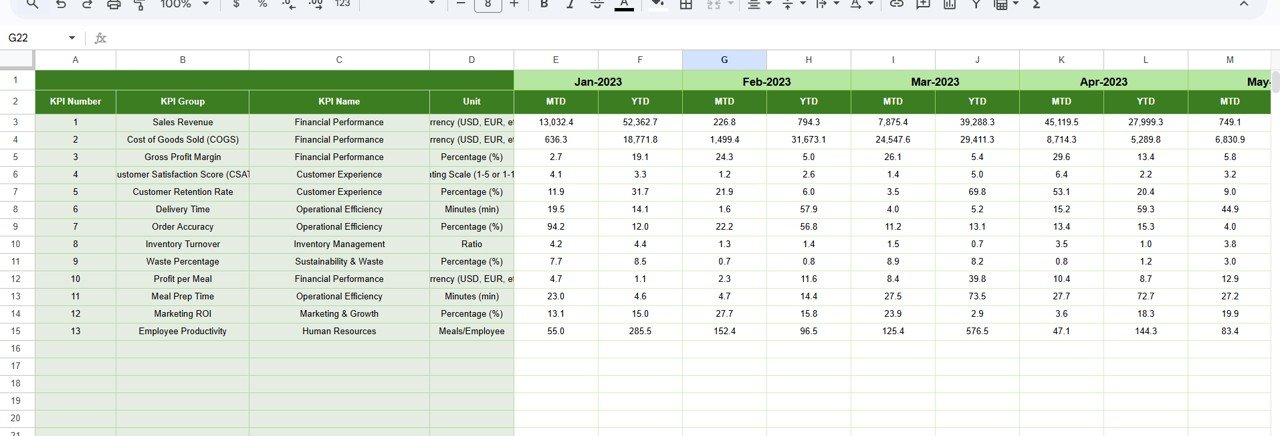
Actual Numbers Input Sheet Tab – Capture Real Business Data
The Actual Numbers Input sheet is where you feed in real performance data every month.
- Month Setup: Enter the first month of your business year in cell E1. The rest of the months auto-populate accordingly.
- Data Entry: Fill in your actual performance figures for both MTD and YTD KPIs.
- Automated Updates: Once you input numbers here, they automatically reflect in the Dashboard and Trend sheets.
This structure keeps your reporting accurate, simple, and consistent.
Click to buy Meal Prep Business KPI Dashboard in Google Sheets
Target Sheet Tab – Define Business Goals
Setting measurable targets is key to success. The Target sheet lets you define both monthly and yearly goals for every KPI.
- MTD and YTD Targets: Assign monthly goals and cumulative yearly targets for all KPIs.
- Performance Comparison: The dashboard automatically compares these targets with actual results to highlight performance gaps.
- Goal Adjustment: You can revise targets anytime to reflect changes in strategy or market conditions.
This ensures every team member knows what success looks like.
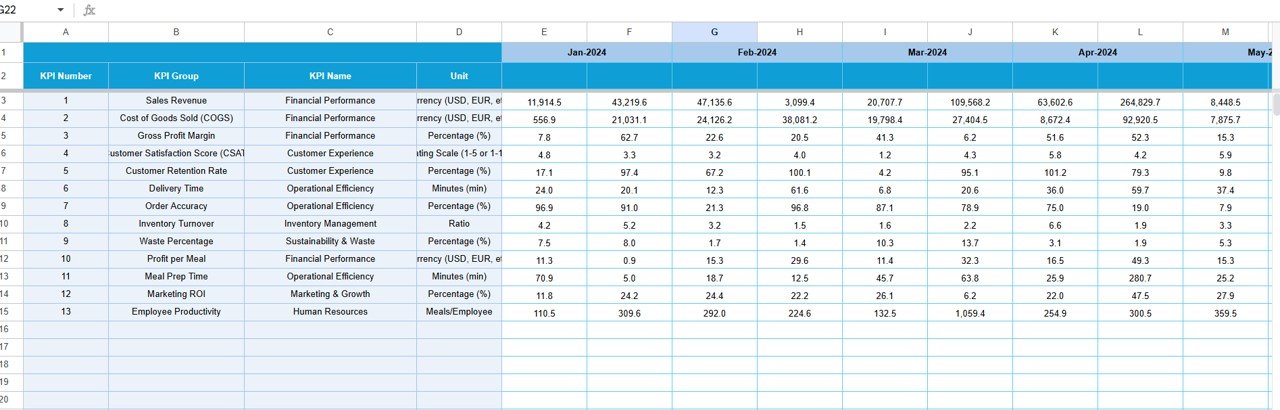
Previous Year Number Sheet Tab – Track Historical Benchmarks
This tab is crucial for growth analysis. Enter your previous year’s numbers here, just as you do for current year data.
- Historical Context: Compare current progress with last year’s performance to measure growth rates.
- Performance Trends: Understand which areas have improved and which need better strategies.
Using past performance as a baseline helps you build realistic goals for the future.
Click to buy Meal Prep Business KPI Dashboard in Google Sheets
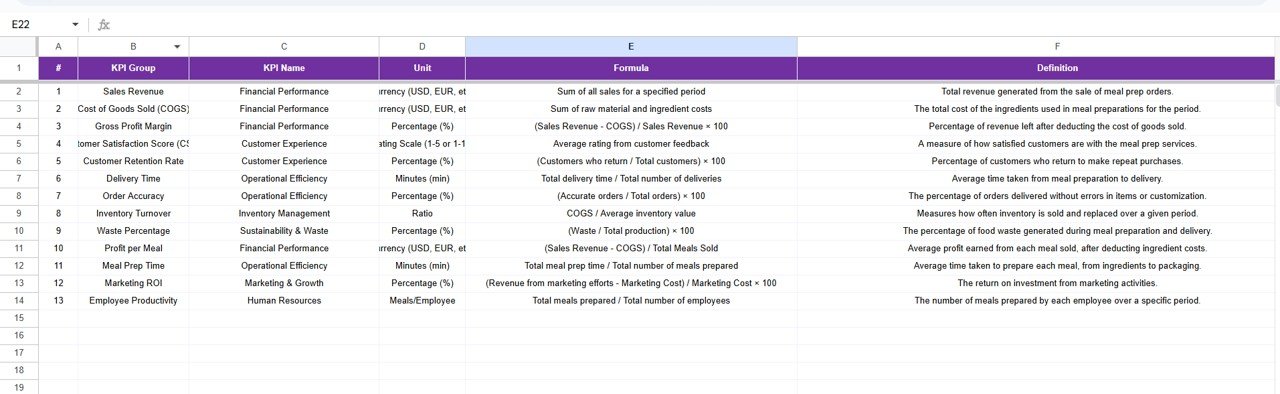
KPI Definition Sheet Tab – Create Clarity and Consistency
This sheet acts as your reference guide for all KPIs.
- KPI Details: Record KPI Name, Group, Unit, Formula, and Definition.
- Standardization: Ensures every stakeholder interprets each KPI the same way.
- Transparency: Helps new team members quickly understand business metrics and objectives.
By maintaining this sheet, you eliminate confusion and promote data consistency across teams.
Key Benefits of Using the Meal Prep Business KPI Dashboard
The advantages of implementing this dashboard go beyond numbers. It helps you create a culture of performance, accountability, and growth.
- Improved Decision-Making
With real-time visibility, managers can make smarter decisions faster. You no longer rely on guesswork — data becomes your compass.
- Greater Efficiency
By centralizing all your KPIs in one place, you save hours of manual report creation every week. Automation keeps your workflow smooth and accurate.
- Cost Control and Profit Growth
Monitor expenses, food waste, and labor costs closely to identify savings opportunities without compromising quality.
- Enhanced Team Alignment
Everyone in your business — from chefs to marketers — works toward measurable goals. The dashboard acts as a shared roadmap for success.
- Data-Driven Accountability
Conditional formatting and visual alerts keep every team accountable for their performance. The transparency motivates improvement.
💡 How Does the Dashboard Help Meal Prep Businesses Grow?
This tool transforms raw data into meaningful business intelligence. Here’s how it fuels growth:
- Spot Trends Early: Identify demand fluctuations or operational bottlenecks before they escalate.
- Enhance Customer Experience: Use customer-related KPIs to improve satisfaction and retention.
- Optimize Marketing: Analyze which campaigns generate the most orders or subscriptions.
- Improve Forecasting: Use historical data to predict future sales and resource needs.
- Track Seasonal Variations: Plan inventory and staffing levels based on recurring patterns.
With every update, your decisions become sharper and your profits more predictable.
Advantages of a Google Sheets-Based KPI Dashboard
While many businesses rely on expensive BI tools, Google Sheets provides unmatched accessibility and flexibility.
- Cloud-Based Accessibility
Access your dashboard from anywhere — at work, at home, or on the go. You only need an internet connection.
- Real-Time Collaboration
Multiple users can edit and view data simultaneously. Perfect for teams working across different locations.
- Zero Software Cost
No need for licenses or installations. Google Sheets is free and simple to use.
- Seamless Integration
Easily connect to Google Forms, Google Data Studio, or third-party tools for automated data imports.
- Ease of Customization
You can expand, modify, or adapt the dashboard to fit your unique meal prep business model without technical assistance.
Setting Up the Meal Prep Business KPI Dashboard Step by Step
Getting started is easier than you might think. Follow these simple steps:
- Download or Copy the Template into your Google Drive.
- Input Your Data: Add actual, target, and previous year numbers in their respective sheets.
- Define KPIs: Fill in KPI definitions with clear formulas.
- Select Month: Use the dropdown in the dashboard to view specific performance results.
- Customize Visuals: Adjust colors, chart styles, or logo placement to match your brand identity.
- Share with Your Team: Give view or edit permissions to key stakeholders.
In just a few minutes, your business will have a real-time, automated performance tracking system ready to go.
Best Practices for Using the Meal Prep Business KPI Dashboard
To get maximum value from your dashboard, follow these proven best practices:
- Keep Data Updated Regularly: Input actuals and targets every month to maintain accuracy.
- Focus on Actionable KPIs: Track metrics that truly impact your business outcomes.
- Avoid Data Overload: Don’t clutter the dashboard with unnecessary metrics. Simplicity drives clarity.
- Use Conditional Formatting Wisely: Highlight key performance areas without overwhelming visuals.
- Review Monthly Trends: Analyze shifts and create action plans for underperforming KPIs.
- Engage Your Team: Encourage cross-departmental discussions using the dashboard insights.
- Revisit Targets Quarterly: Adjust goals based on seasonal trends and market feedback.
- Maintain Data Integrity: Double-check formulas and references to prevent reporting errors.
Consistent and disciplined dashboard management ensures continuous improvement and strategic alignment.
Real-World Impact Example
Imagine you run a meal prep service delivering 500 meals daily. Using this dashboard, you notice that your On-Time Delivery Rate dropped from 98% to 90% in March. After checking your operations, you discover driver shortages during peak hours.
You quickly adjust delivery schedules, hire part-time drivers, and by April, the metric rises to 97%. The dashboard helps you pinpoint issues fast — turning data into immediate solutions.
That’s the power of visualization and structured analysis.
Why Every Meal Prep Business Needs KPI Tracking
In today’s competitive food industry, data is the secret ingredient to success. You can’t improve what you don’t measure.
Whether you’re managing a local kitchen or a nationwide subscription service, KPI tracking helps you:
- Identify profitability drivers.
- Maintain quality consistency.
- Reduce waste and costs.
- Boost customer loyalty.
- Predict growth patterns.
A KPI dashboard ensures that every decision you make is based on facts — not assumptions.
Conclusion
The Meal Prep Business KPI Dashboard in Google Sheets brings clarity, structure, and insight to one of the fastest-growing business models in the food industry. It converts scattered data into actionable intelligence that guides daily decisions and long-term planning.
From revenue analysis to operational optimization, this dashboard simplifies performance management while empowering your team with data visibility. Best of all, it runs on Google Sheets — making it affordable, flexible, and accessible to everyone.
If you want to take your meal prep business to the next level, this dashboard isn’t just helpful — it’s essential.
Frequently Asked Questions (FAQs)
- What are the main KPIs to track in a meal prep business?
You should track sales, food cost, customer retention, delivery accuracy, and profit margin. These KPIs help you balance efficiency, quality, and profitability.
- Can I customize the Meal Prep Business KPI Dashboard?
Yes. You can add, rename, or modify KPIs, formulas, and visuals easily since it’s built entirely in Google Sheets.
- How often should I update my dashboard?
Update it monthly or weekly depending on your data availability. Consistent updates ensure reliable insights.
- Is Google Sheets suitable for large data volumes?
Yes, but if your data exceeds 5 million cells, consider linking it to Google BigQuery or Google Data Studio for extended analysis.
- Do I need any technical skills to use this dashboard?
No. The template is completely beginner-friendly. You just input your data — all formulas and visuals work automatically.
- Can multiple users work on this dashboard at once?
Absolutely. Google Sheets allows real-time collaboration, so your entire team can update and review data simultaneously.
- How can this dashboard improve my profits?
By identifying inefficiencies, monitoring costs, and tracking growth trends, you can make data-driven decisions that directly boost profitability.
Visit our YouTube channel to learn step-by-step video tutorials
Youtube.com/@NeotechNavigators
Watch the step-by-step video tutorial:
Click to buy Meal Prep Business KPI Dashboard in Google Sheets