The media and entertainment industry thrives on creativity, innovation, and performance. However, to truly succeed in a competitive environment, it’s essential for organizations to track and measure their performance against key metrics. A Media & Entertainment KPI Dashboard in Google Sheets is an excellent tool for managing and visualizing key performance indicators (KPIs) in this dynamic sector.
In this article, we will explore how to effectively use the Media & Entertainment KPI Dashboard in Google Sheets, its key features, the advantages it offers, and best practices for maximizing its potential. We will also provide a list of the most common KPIs used in the media and entertainment industry, along with their units, formulas, and definitions.
Table of Contents
ToggleWhat is a Media & Entertainment KPI Dashboard in Google Sheets?
A Media & Entertainment KPI Dashboard in Google Sheets is a data visualization tool designed to help businesses in the media and entertainment industry track key performance metrics. The dashboard aggregates data from various sources and displays it in an easily digestible format using Google Sheets, a free and widely used spreadsheet tool.
The dashboard typically includes different worksheets to manage various aspects of performance, from actual numbers and targets to year-over-year comparisons. By visualizing these KPIs, businesses can gain insights into their operations and make data-driven decisions to optimize their performance.
Key Features of the Media & Entertainment KPI Dashboard in Google Sheets
The Media & Entertainment KPI Dashboard in Google Sheets includes six primary worksheets, each designed to serve a unique purpose. Let’s dive into the details of these worksheets:
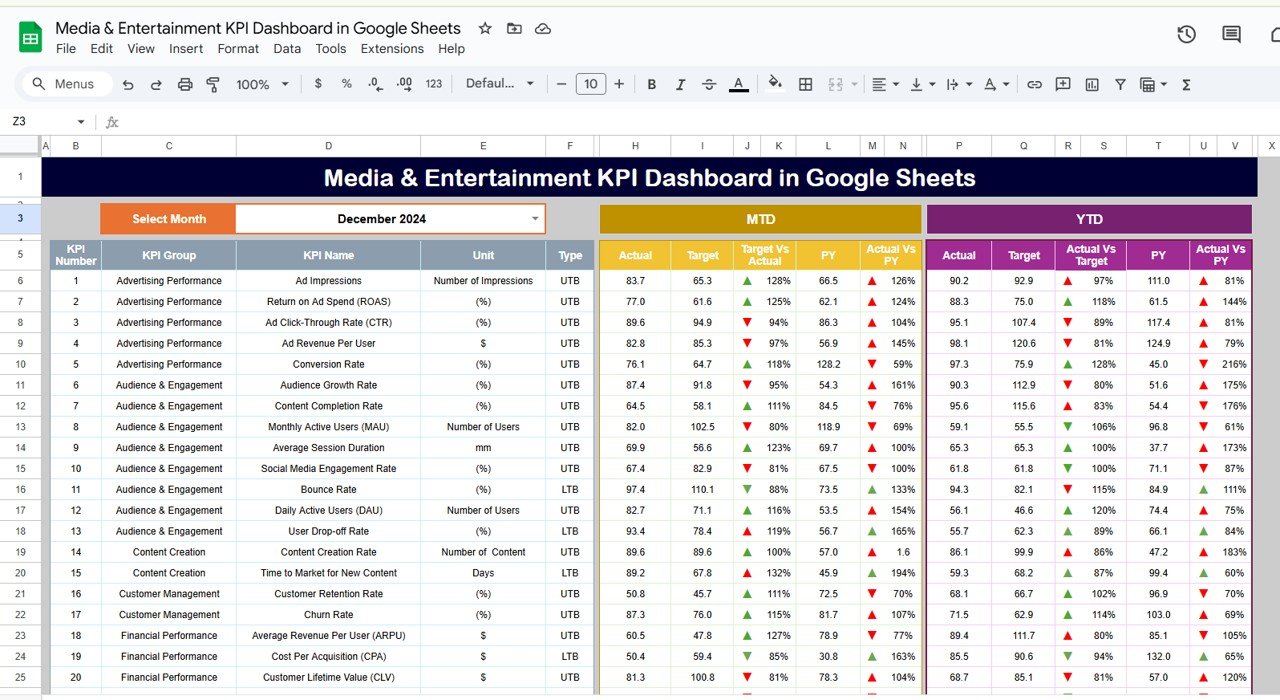
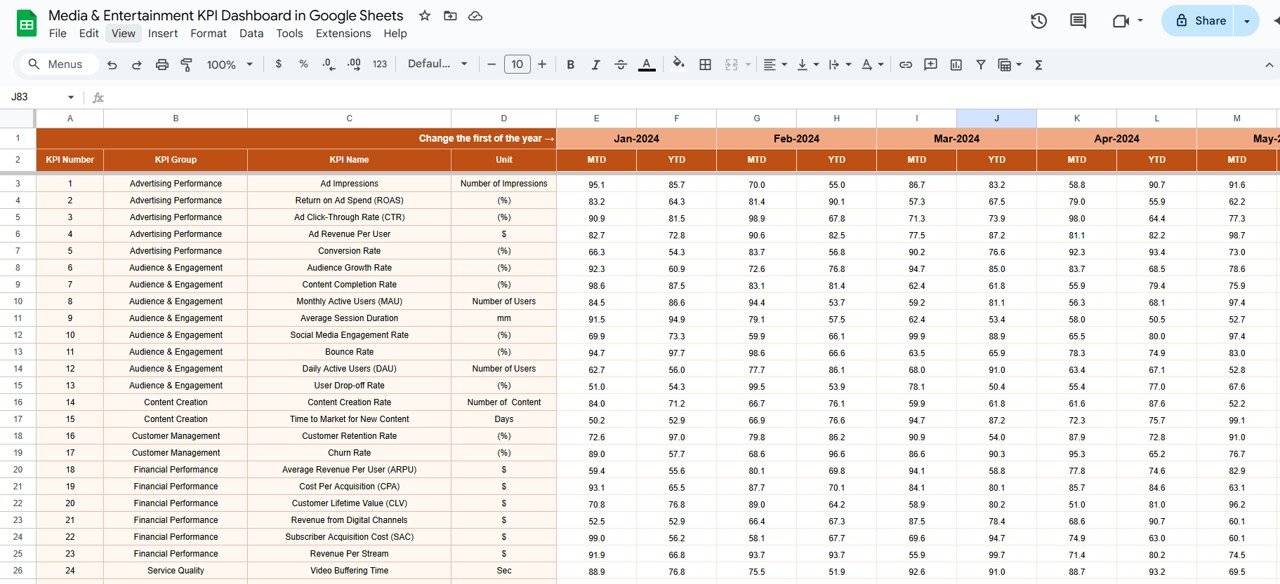
1. Dashboard Sheet Tab
The Dashboard Sheet Tab is the main page of the KPI dashboard. Here, users can track and visualize all KPIs related to their media and entertainment business. Key features include:
Month Selection: The user can select the month from the drop-down menu in Range D3. The entire dashboard updates automatically based on the selected month.
MTD and YTD Metrics:
- MTD Actual: The actual value for the current month-to-date (MTD).
- MTD Target: The target value for the current MTD.
- Previous Year Data: Compares the current MTD data with the same period in the previous year.
- Target vs Actual: Shows the comparison between the MTD actual value and the target value using conditional formatting with up and down arrows (▲ or ▼).
- YTD Actual: The year-to-date (YTD) actual value.
- YTD Target: The YTD target value.
- Previous Year Data for YTD: Compares the current YTD data with the previous year’s data.
- Target vs Actual for YTD: Displays the comparison between the YTD actual value and the target value.
This worksheet serves as the main hub for monitoring performance, providing real-time insights into how well the organization is meeting its KPIs.
Click to buy Media & Entertainment KPI Dashboard in Google Sheets
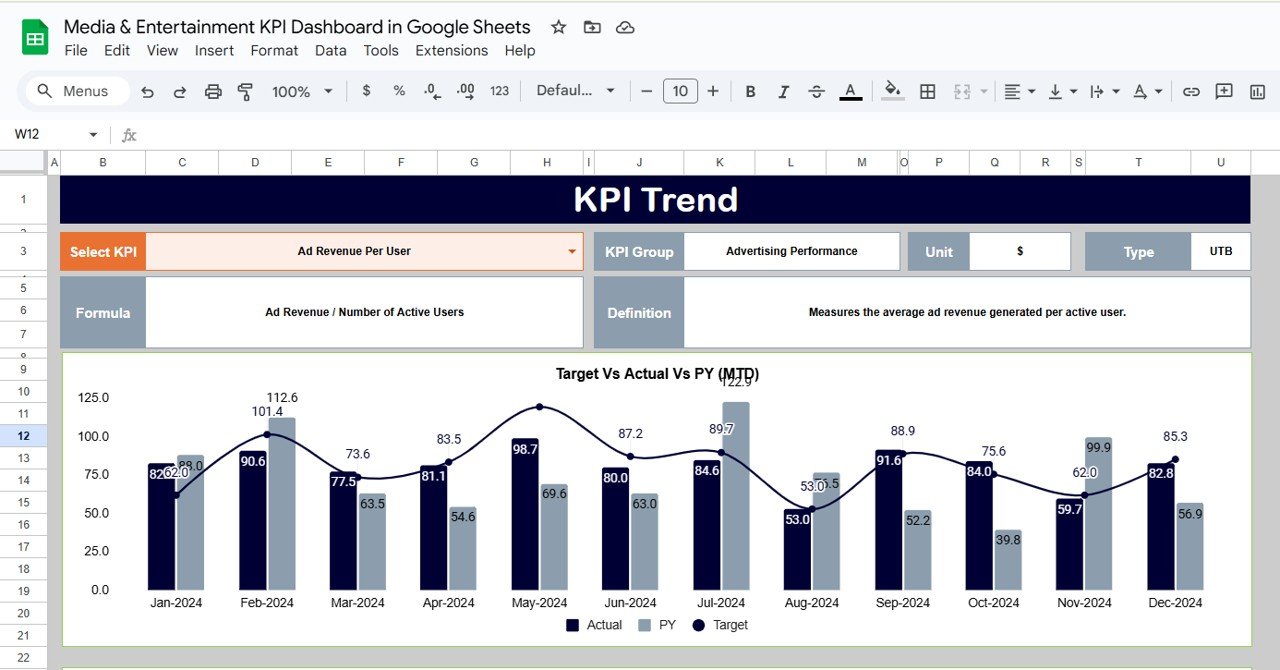
2. KPI Trend Sheet Tab
The KPI Trend Sheet Tab allows users to track the trends of specific KPIs over time. Key features include:
-
KPI Selection: The user can select a specific KPI from the drop-down menu available in Range C3.
-
KPI Details: The KPI group, unit of measurement, and whether the KPI is “Lower the Better” (LTB) or “Upper the Better” (UTB) are displayed.
-
Formula and Definition: This sheet shows the formula used to calculate the KPI and provides a clear definition to help users understand what each KPI measures.
This sheet is useful for analyzing trends and understanding how KPIs evolve over time, helping businesses identify areas that require attention.
Click to buy Media & Entertainment KPI Dashboard in Google Sheets
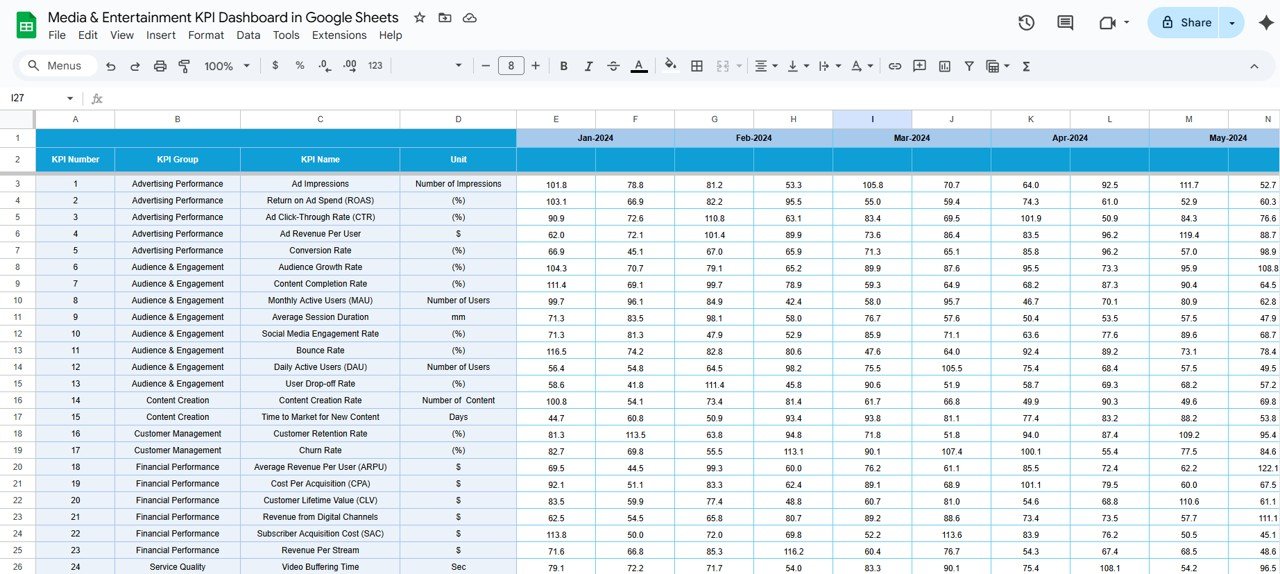
3. Actual Number Sheet Tab
The Actual Number Sheet Tab is where users input the actual data for MTD and YTD metrics. Key features include:
-
Month Input: The user can change the month by selecting the first month of the year in Range E1. The actual numbers for MTD and YTD will automatically update for the selected month.
-
MTD and YTD Data Input: Users enter the actual values for each KPI in this sheet, which will be used for comparison against the targets.
This sheet helps ensure that the dashboard displays up-to-date actual performance data.
Click to buy Media & Entertainment KPI Dashboard in Google Sheets
4. Target Sheet Tab
The Target Sheet Tab is used to input the target values for each KPI. Features of this tab include:
-
MTD and YTD Targets: Users enter the target values for each KPI, both for the current month (MTD) and for the year-to-date (YTD).
This sheet helps track progress against set goals and provides a basis for comparison when analyzing performance.
5. Previous Year Number Sheet Tab
The Previous Year Number Sheet Tab allows users to enter the data for the same period in the previous year. Key features include:
-
Previous Year MTD and YTD Data Input: Users enter the previous year’s actual values for comparison against current year data.
This sheet allows businesses to evaluate their performance by comparing it with historical data and spotting long-term trends.
Click to buy Media & Entertainment KPI Dashboard in Google Sheets
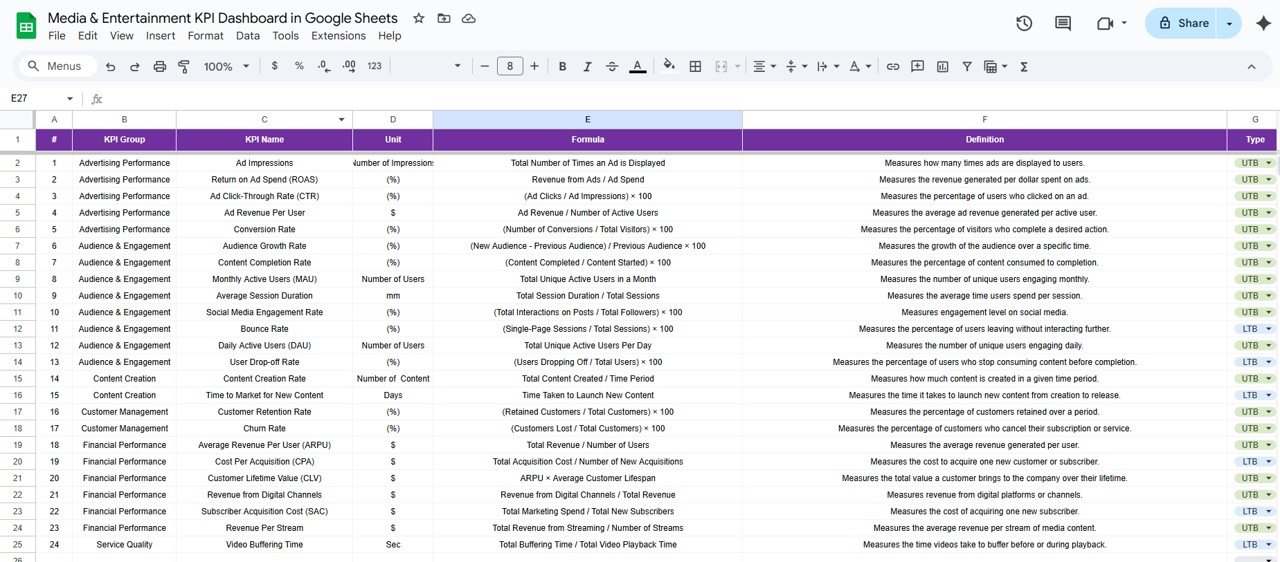
The KPI Definition Sheet Tab provides detailed definitions and formulas for each KPI. Key features include:
-
KPI Name, KPI Group, Unit, Formula, and Definition: This sheet contains a comprehensive list of all KPIs, their respective groups, units, and the formulas used to calculate them. It also provides definitions to clarify how each KPI is measured.
This sheet ensures consistency in how KPIs are defined and calculated across the organization.
Advantages of Using the Media & Entertainment KPI Dashboard in Google Sheets
The Media & Entertainment KPI Dashboard in Google Sheets offers several advantages for businesses in the industry:
- Real-Time Data Tracking: With Google Sheets, you can update the dashboard in real-time, ensuring that the data is always up-to-date. This is especially important in a fast-moving industry like media and entertainment.
- Easy to Use and Accessible: Google Sheets is user-friendly and accessible from any device with internet access. This makes it easy for teams to collaborate and monitor performance from anywhere.
- Comprehensive Data Visualization: The dashboard provides comprehensive data visualization with metrics like MTD, YTD, and year-over-year comparisons. This helps decision-makers quickly assess the performance of their KPIs and make adjustments if needed.
- Cost-Effective Solution: Using Google Sheets is a cost-effective solution compared to expensive business intelligence tools. With its powerful features and integration with other Google Workspace tools, it’s a great option for businesses looking to monitor KPIs without a large investment.
Opportunity for Improvement in the Media & Entertainment KPI Dashboard
Click to buy Media & Entertainment KPI Dashboard in Google Sheets
While the Media & Entertainment KPI Dashboard in Google Sheets offers many benefits, there are some opportunities for improvement:
- Automation of Data Inputs: Currently, data needs to be manually entered into the sheets. Automating data imports from other sources, such as analytics platforms or financial systems, could save time and improve accuracy.
- Integration with Other Tools: Integrating the dashboard with other platforms, such as Google Analytics, CRM systems, or advertising platforms, could help provide more comprehensive insights and improve decision-making.
- Advanced Analytics: Adding advanced analytics features like predictive modeling and trend forecasting could help businesses better understand future performance and adjust strategies accordingly.
Best Practices for Using the Media & Entertainment KPI Dashboard
To make the most out of the Media & Entertainment KPI Dashboard, here are some best practices to follow:
- Regular Data Updates: Ensure that the data is updated regularly to reflect the most current performance metrics. Regular updates are essential for making timely, informed decisions.
- Set Clear and Achievable Targets: Set realistic and achievable targets for each KPI to motivate the team and ensure that progress is measurable. Targets should be aligned with overall business objectives.
- Monitor Trends and Adjust Strategies: Use the trend analysis features of the dashboard to identify long-term trends and adjust strategies accordingly. Regularly reviewing trends helps businesses stay competitive in a fast-changing industry.
- Encourage Cross-Department Collaboration: Encourage collaboration between different departments (e.g., marketing, content creation, finance) by sharing the dashboard. This ensures that everyone is aligned and working towards common goals.
Frequently Asked Questions (FAQs)
1. How do I customize the Media & Entertainment KPI Dashboard?
You can customize the dashboard by adjusting the KPIs, targets, and data inputs based on your business’s needs. Simply modify the relevant data in the Actual Number Sheet and Target Sheet.
2. Can I integrate the dashboard with other analytics tools?
Yes, you can integrate Google Sheets with other analytics platforms like Google Analytics or CRM systems using add-ons or scripts for automatic data syncing.
3. How often should I update the dashboard?
It’s best to update the dashboard at least once a month. However, for more real-time insights, you may want to update it weekly or even daily.
4. Can I add more KPIs to the dashboard?
Yes, you can easily add more KPIs by modifying the KPI Definition Sheet and updating the data inputs in the Actual Number Sheet and Target Sheet.
5. How do I track year-over-year performance?
Year-over-year comparisons can be made by entering previous year data in the Previous Year Number Sheet and comparing it with the current year’s data in the dashboard.
Conclusion
The Media & Entertainment KPI Dashboard in Google Sheets is a powerful and cost-effective tool that enables businesses to monitor key performance metrics, make informed decisions, and optimize performance. By following the best practices and continuously improving the dashboard, media and entertainment companies can stay ahead in a competitive market, track progress towards their goals, and ensure long-term success.
Visit our YouTube channel to learn step-by-step video tutorials
Youtube.com/@NeotechNavigators
Watch the step-by-step video Demo:
Click to buy Media & Entertainment KPI Dashboard in Google Sheets