Efficiently managing meeting rooms is essential for modern organizations. The Meeting Room Utilization Dashboard in Google Sheets is a ready-to-use tool that helps track bookings, monitor occupancy, and analyze meeting trends to maximize room usage.Meeting Room Utilization Dashboard in Google Sheets
In this article, we will explain the key features, advantages, and best practices for using this dashboard.Meeting Room Utilization Dashboard in Google Sheets
What Is a Meeting Room Utilization Dashboard?
A Meeting Room Utilization Dashboard consolidates data on room bookings, meeting duration, attendee count, and booking status. It provides managers with actionable insights to:
-
Monitor meeting room usage in real-time
-
Identify underutilized rooms or peak usage periods
-
Optimize resources for better scheduling
-
Make data-driven decisions to improve efficiency
Using Google Sheets makes this dashboard highly collaborative, easy to maintain, and accessible from anywhere.
Key Features of the Dashboard
Click to Buy Meeting Room Utilization Dashboard in Google Sheets
This dashboard includes three main sheets:
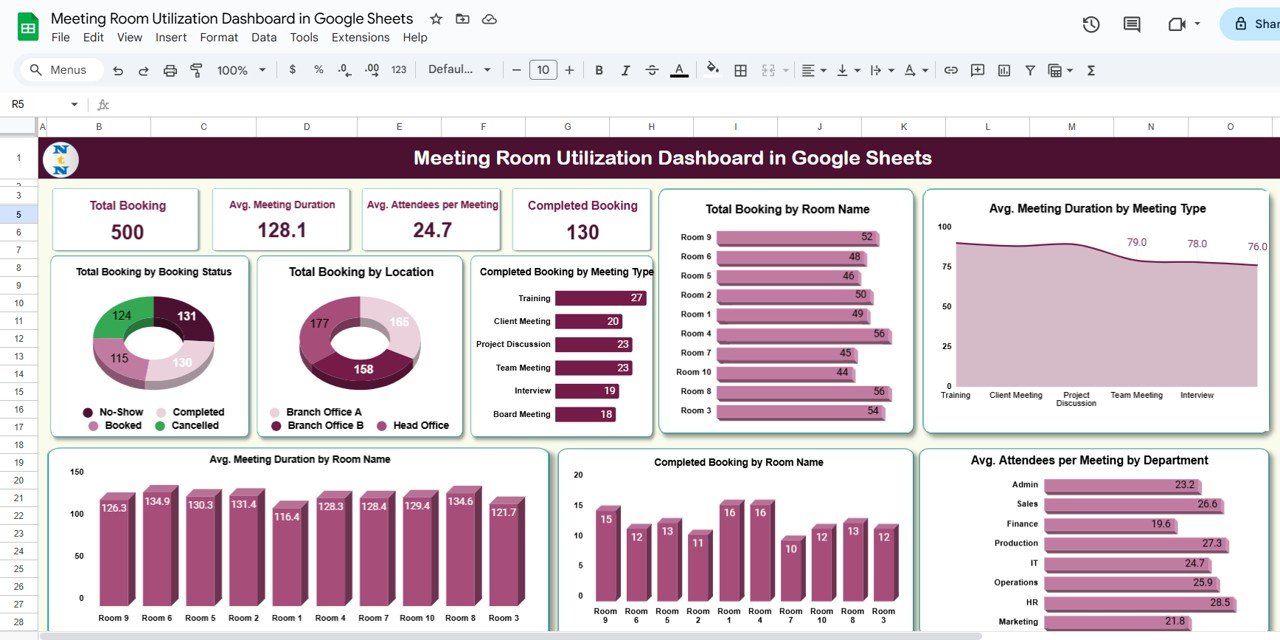
1. Dashboard Sheet Tab
The Dashboard sheet provides an overview with cards and charts.
Cards:
-
Total Booking: Total number of meetings scheduled
-
Avg. Meeting Duration: Average duration of meetings
-
Avg. Attendees per Meeting: Average number of participants
-
Completed Booking: Total completed meetings
Charts:
-
Total Booking by Booking Status: Tracks pending, completed, or canceled bookings
-
Total Booking by Location: Identifies which locations are most utilized
-
Completed Booking by Meeting Type: Shows which meeting types are most frequent
-
Total Booking by Room Name: Monitors room-specific bookings
-
Avg. Meeting Duration by Meeting Type: Compares time spent for each meeting type
-
Avg. Attendees per Meeting by Department: Evaluates department-level participation
-
Completed Booking by Room Name: Shows which rooms are most frequently used
-
Avg. Meeting Duration by Room Name: Highlights time allocation per room
Click to Buy Meeting Room Utilization Dashboard in Google Sheets
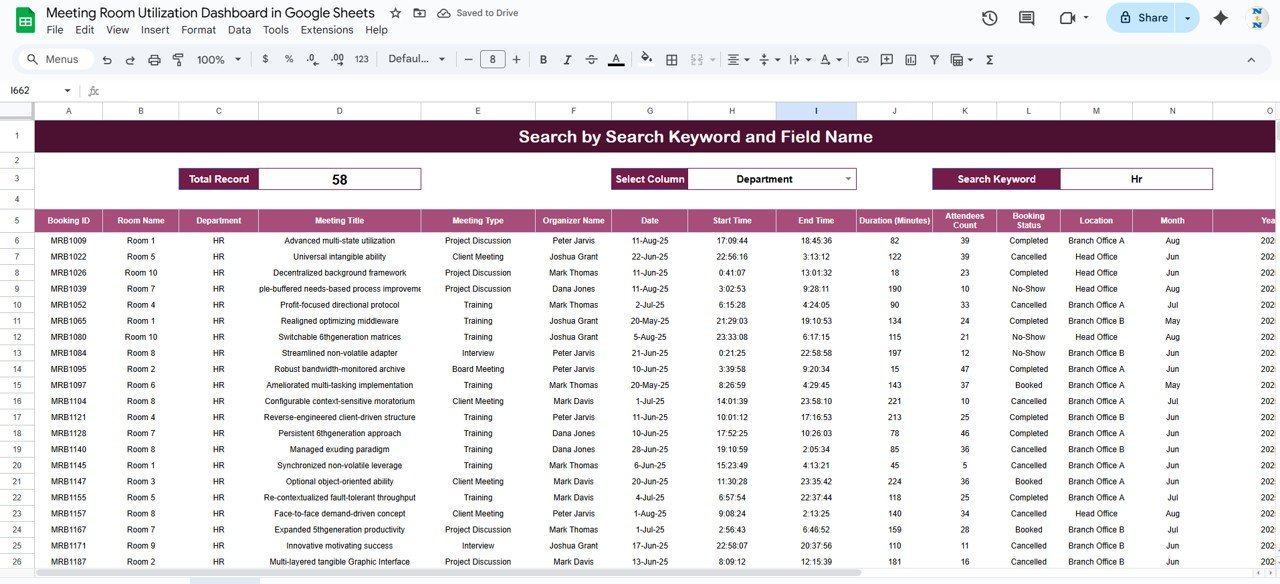
2. Search Sheet Tab
The Search sheet allows users to quickly find specific meetings:
-
Search by keyword and field name
-
Efficiently locate bookings for specific rooms, departments, or types
Click to Buy Meeting Room Utilization Dashboard in Google Sheets
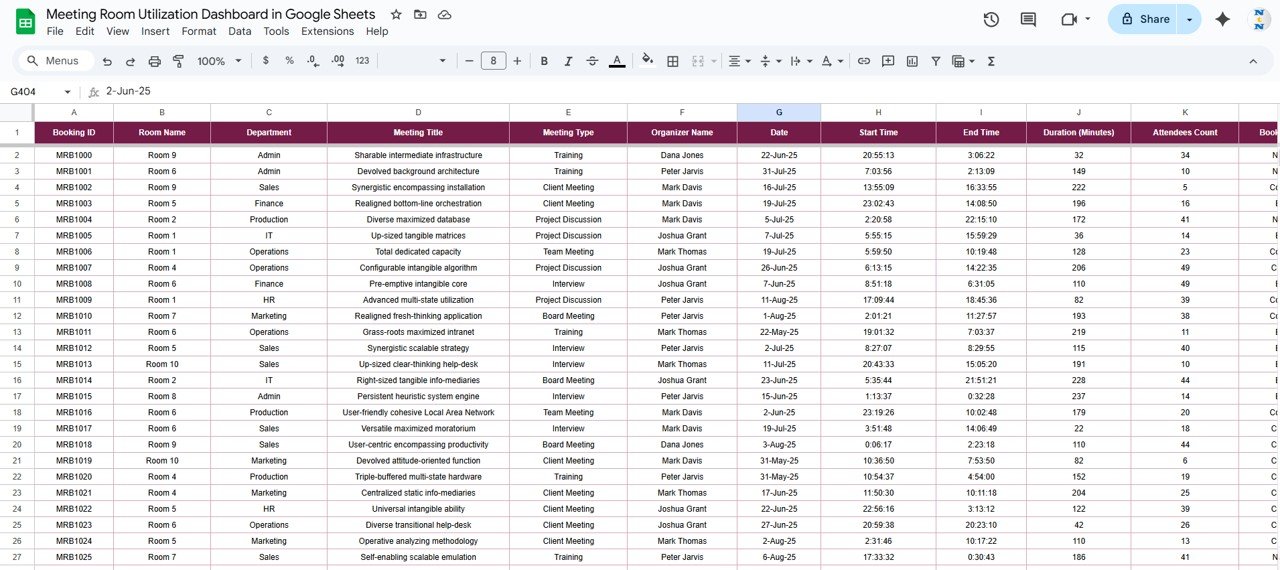
3. Data Sheet Tab
The Data sheet serves as the input sheet where all meeting information is recorded:
-
Date and time of meetings
-
Meeting room and location
-
Meeting type and department
-
Number of attendees
-
Status (Completed, Pending, Canceled)
All updates in the Data sheet reflect automatically on the Dashboard and Search sheets.
Click to Buy Meeting Room Utilization Dashboard in Google Sheets
Advantages of Using the Meeting Room Utilization Dashboard
-
Centralized Tracking: All meeting information in one place
-
Visual Insights: Charts and cards make trends easy to interpret
-
Optimize Room Usage: Identify underutilized or overbooked rooms
-
Improve Scheduling: Allocate rooms and resources more efficiently
-
Data-Driven Decisions: Monitor trends and take corrective actions
-
Collaborative: Multiple team members can update and access the dashboard
Best Practices for Using the Dashboard
-
Update Data Regularly: Enter all bookings promptly to maintain accuracy
-
Segment by Room and Department: Analyze usage trends for better allocation
-
Monitor Duration and Attendance: Track average duration and participation per meeting
-
Use Search Effectively: Quickly locate meetings by room, department, or type
-
Review Trends Over Time: Use historical data to plan room resources for future months
How This Dashboard Helps Organizations
Click to Buy Meeting Room Utilization Dashboard in Google Sheets
-
Increase Efficiency: Optimize meeting room usage and reduce idle time
-
Improve Planning: Allocate resources and plan high-demand meeting times
-
Monitor Employee Engagement: Track participation across departments
-
Support Remote or Hybrid Work: Analyze room usage patterns to adjust office space needs
-
Reduce Conflicts: Identify double bookings or overbooked rooms in advance
Frequently Asked Questions (FAQs)
Q1: Can I customize the dashboard for my office layout?
Yes, you can modify room names, locations, departments, and meeting types to match your office setup.
Q2: Can multiple people update the dashboard simultaneously?
Yes, Google Sheets allows real-time collaboration with multiple users.
Q3: How do I track recurring meetings?
You can either duplicate entries for recurring meetings or use formulas to calculate recurring patterns.
Q4: Can I analyze utilization trends by department or meeting type?
Yes, the dashboard includes charts for department-level and meeting type-level analysis.
Q5: Does the dashboard show booking completion status?
Yes, cards and charts indicate completed, pending, and canceled bookings.
Conclusion
Click to Buy Meeting Room Utilization Dashboard in Google Sheets
The Meeting Room Utilization Dashboard in Google Sheets is a powerful tool for tracking, analyzing, and optimizing your workspace. With real-time insights, visual trends, and easy search functionality, it helps organizations allocate meeting rooms efficiently, improve planning, and maximize productivity.
Visit our YouTube channel to learn step-by-step video tutorials
Youtube.com/@NeotechNavigators
Watch the step-by-step video Demo:
Click to Buy Meeting Room Utilization Dashboard in Google Sheets