Managing memberships effectively is a key challenge for subscription-based businesses, clubs, associations, and organizations. Monitoring subscription growth, member retention, revenue per member, and overall engagement requires a structured system. To address this, we have created the Membership Management KPI Dashboard in Google Sheets, a ready-to-use template that helps you track and analyze all membership-related KPIs in one place.Membership Management KPI Dashboard in Google Sheets
This article will guide you through the dashboard features, advantages, best practices, and frequently asked questions.Membership Management KPI Dashboard in Google Sheets
What is a Membership Management KPI Dashboard?
A Membership Management KPI Dashboard is a visual tool that consolidates all critical membership metrics in a single Google Sheets file. It helps organizations monitor growth, retention, revenue, and operational efficiency.
By using this dashboard, managers can:
-
Track monthly and yearly membership metrics.
-
Compare actual performance against targets.
-
Identify trends in membership engagement.
-
Make data-driven decisions to improve growth and retention.
Key Features of the Membership Management KPI Dashboard
Click to Buy Membership Management KPI Dashboard in Google Sheets
This dashboard is structured into six worksheets, each serving a unique purpose:
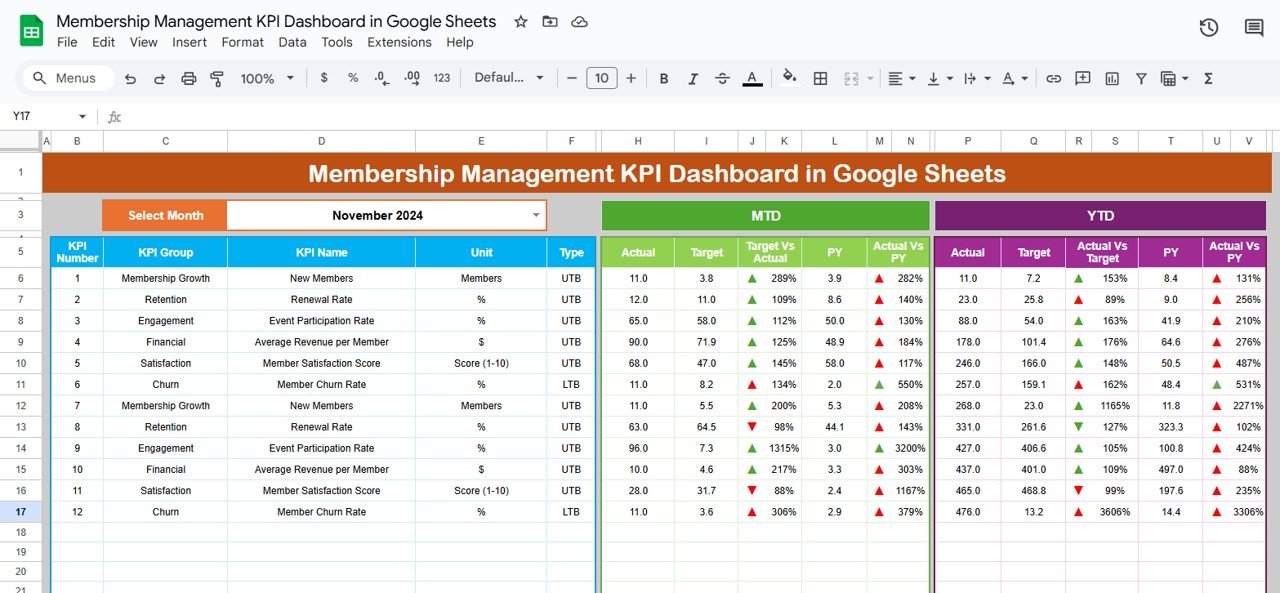
1. Dashboard Sheet Tab
This is the main sheet tab where all KPI information is displayed.
-
Month Selection: Use the dropdown in cell D3 to select a month. All dashboard numbers will update automatically for the selected month.
Metrics Displayed:
- MTD (Month-to-Date): Actual, Target, Previous Year values with up/down conditional formatting arrows.
- YTD (Year-to-Date): Actual, Target, Previous Year values with conditional formatting arrows.
Comparison Metrics:
- Target vs Actual: Percentage calculation using formula
- PY vs Actual: Percentage comparison with previous year using formula
The Dashboard Sheet allows quick evaluation of membership performance for any selected month.
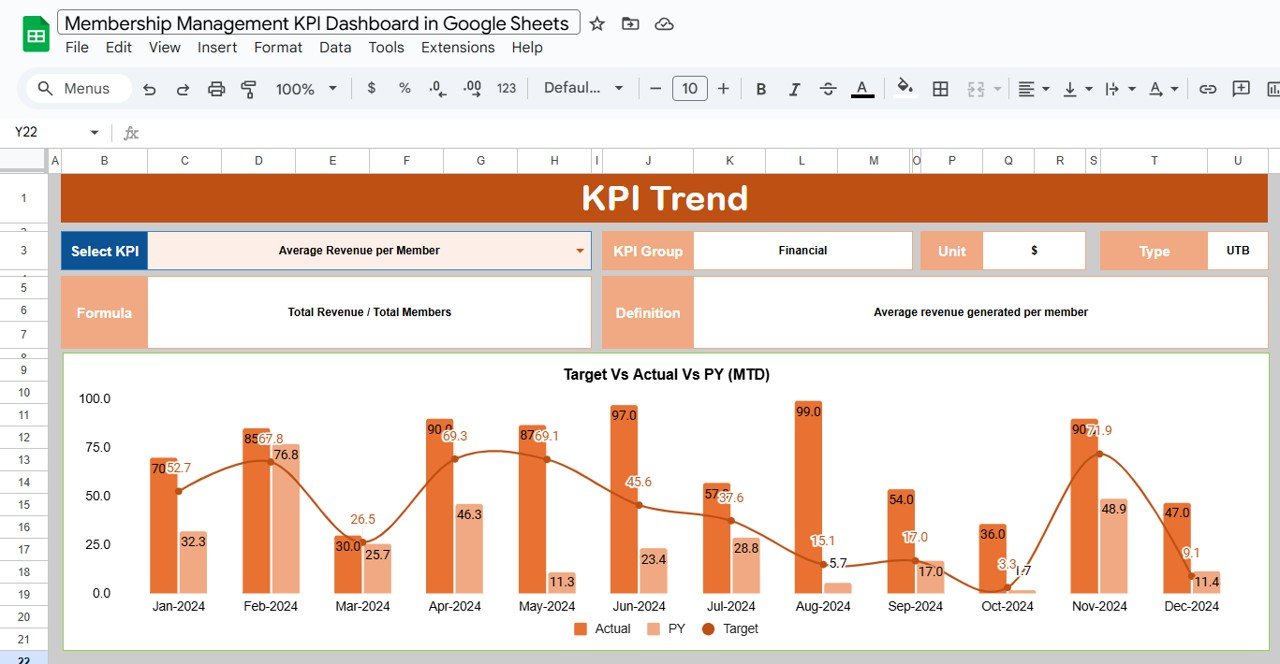
2. KPI Trend Sheet Tab
This sheet provides a detailed view of each KPI.
KPI Selection: Use the dropdown in cell C3 to select a KPI.
Displayed Information:
- KPI Group
- Unit of KPI (e.g., Number of Members, Revenue $)
- KPI Type: LTB (Lower the Better) or UTB (Upper the Better)
- Formula: How the KPI is calculated
- Definition: Explanation of the KPI
This sheet helps understand how each KPI contributes to overall membership performance and allows detailed trend analysis.
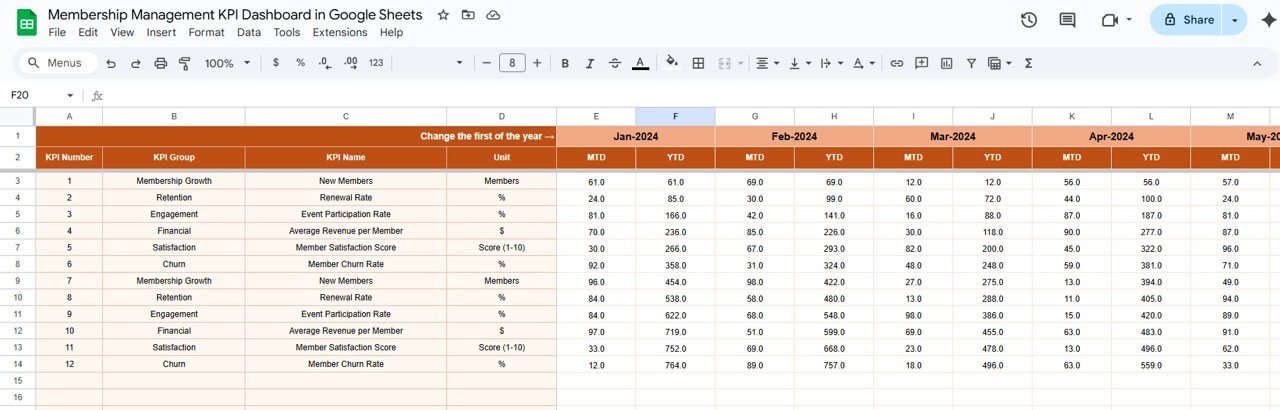
3. Actual Numbers Sheet Tab
-
Enter the actual values for all KPIs, both MTD and YTD, for a selected month.
-
Month Selection: Change the first month of the year in cell E1 to update the data range.
This sheet ensures that the dashboard always reflects real-time performance.
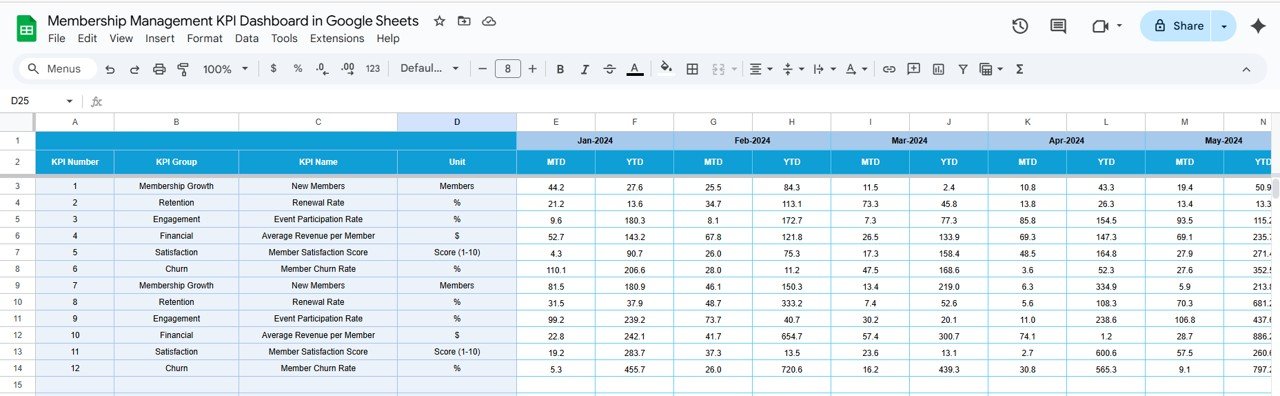
4. Target Sheet Tab
-
Enter the target numbers for each KPI for the selected month.
-
Track both MTD and YTD targets to monitor if performance meets business objectives.
This sheet ensures goal alignment and helps measure success accurately.
5. Previous Year Numbers Sheet Tab
-
Input previous year KPI values here, similar to the current year.
-
Compare current performance against last year to understand growth trends, seasonality, and improvements.
This sheet supports year-over-year analysis, helping you identify long-term patterns in membership performance.

6. KPI Definition Sheet Tab
Record all KPI-related details including:
- KPI Name
- KPI Group
- Unit
- Formula
- Definition
This sheet acts as a reference for all KPIs and ensures consistency in measurement and reporting.

Advantages of the Membership Management KPI Dashboard
Implementing this dashboard offers several benefits:
-
Centralized Data: All membership KPIs are tracked in one place.
-
Visual Analysis: Easily track performance with conditional formatting, trend charts, and comparisons.
-
Improved Decision Making: Real-time insights allow timely interventions.
-
Customizable: Modify KPIs, formulas, or target values based on your business needs.
-
Year-over-Year Comparison: Track performance against previous years to identify trends.
-
Time-Saving: Automates calculations and visualization, reducing manual effort.
Best Practices for Using the Membership Management KPI Dashboard
-
Update Actual Numbers Promptly: Regularly input MTD and YTD actuals to keep data accurate.
-
Set Realistic Targets: Ensure target values are achievable and aligned with business goals.
-
Monitor KPI Trends: Use the KPI Trend sheet to identify underperforming metrics.
-
Use Conditional Formatting Wisely: Red and green arrows help quickly identify performance issues.
-
Review Year-over-Year Data: Compare with the previous year to understand growth and retention trends.
-
Customize KPIs as Needed: Add or modify KPIs to align with evolving business requirements.
How to Use the Membership Management KPI Dashboard
-
Open the Google Sheet: Access the template and review all sheets.
-
Enter Actual Numbers: Fill in MTD and YTD actuals in the Actual Numbers sheet.
-
Set Targets: Enter target values for each KPI in the Target sheet.
-
Update Previous Year Data: Fill in last year’s numbers in the Previous Year sheet for comparisons.
-
Analyze Trends: Use the Dashboard and KPI Trend sheets to review performance, identify gaps, and make informed decisions.
-
Reference KPI Definitions: Check the KPI Definition sheet for clarity on metrics, formulas, and measurement methods.
Frequently Asked Questions (FAQs)
1. Can I add more KPIs to this dashboard?
Yes, the template is fully customizable. You can add additional KPIs in the KPI Definition sheet and update Actual, Target, and PY sheets accordingly.
2. Can multiple users update the dashboard simultaneously?
Yes, Google Sheets supports real-time collaboration, so multiple users can input data simultaneously.
3. Is it possible to track KPIs monthly and annually?
Absolutely. The dashboard shows MTD (Month-to-Date) and YTD (Year-to-Date) metrics for all KPIs.
4. Can I track KPIs with different units?
Yes, each KPI has a unit field, allowing you to track numbers, percentages, revenue, or any other measurement.
5. Does the dashboard indicate performance visually?
Yes, it uses conditional formatting arrows to indicate if KPIs are meeting targets (green ↑ for good, red ↓ for underperformance).
Visit our
Watch the step-by-step video Demo:
to learn step-by-step video tutorials