Managing mental health services involves tracking complex data — patient progress, staff workload, service quality, and treatment outcomes. Without structured data visualization, teams may miss early warning signs or operational inefficiencies. That’s why the Mental Health Services KPI Dashboard in Google Sheets is a game-changer.
This interactive and ready-to-use dashboard helps healthcare professionals, administrators, and policymakers monitor key performance indicators (KPIs) in real time. Built entirely in Google Sheets, it’s cloud-based, collaborative, and customizable — perfect for modern healthcare environments.
Click to buy Mental Health Services KPI Dashboard in Google Sheets
What Is a Mental Health Services KPI Dashboard in Google Sheets?
A Mental Health Services KPI Dashboard is a digital tool that tracks, visualizes, and analyzes performance data from mental health programs or facilities.
Using Google Sheets, it consolidates data across departments — from patient intake to therapy sessions and recovery outcomes — into one central platform.
This allows leaders to:
- Track monthly and yearly performance
- Identify improvement areas
- Compare progress against targets and previous years
- Make data-driven decisions instantly
Unlike static reports, this dashboard automatically updates as data changes, giving a live view of all critical KPIs.
Key Features of the Mental Health Services KPI Dashboard
This comprehensive Google Sheets dashboard includes six functional worksheets, each serving a unique analytical purpose:
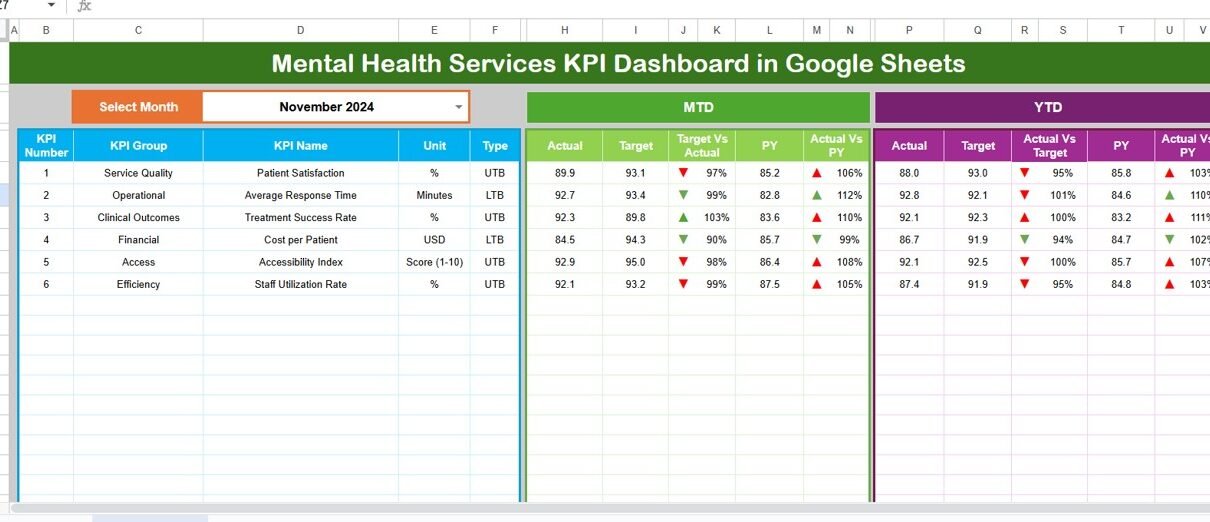
Dashboard Sheet Tab
This is the main interface of the file.
- You can select any month using the dropdown in cell D3.
- The dashboard instantly updates to display Month-to-Date (MTD) and Year-to-Date (YTD) data.
- Conditional formatting adds visual appeal — with green and red arrows showing performance trends against targets and previous years.
- The sheet presents both MTD and YTD Actual, Target, and Previous Year values for each KPI, making it easy to identify whether performance is improving or declining.

Click to buy Mental Health Services KPI Dashboard in Google Sheets
Trend Sheet Tab
This sheet focuses on performance trends over time.
- Use the dropdown in cell C3 to select any KPI.
- It displays the KPI Group, Unit, Formula, Definition, and Type (Lower the Better or Upper the Better).
- You can view MTD and YTD charts comparing Actual vs Target vs Previous Year, which helps visualize trends across months.
- This feature is especially helpful for spotting seasonal patterns in patient volume or therapy effectiveness.

Click to buy Mental Health Services KPI Dashboard in Google Sheets
Actual Numbers Input Sheet
Data entry becomes simple and organized.
- Input actual performance numbers for each KPI, both MTD and YTD.
- You can set the first month of the year in cell E1, and the sheet will automatically adjust all month columns accordingly.
- This design ensures easy customization for organizations with fiscal years differing from the calendar year.

Click to buy Mental Health Services KPI Dashboard in Google Sheets
Target Sheet Tab
Here, you define monthly and yearly goals.
- Input target values for every KPI — both MTD and YTD.
- Comparing these targets with actuals helps assess progress and plan corrective actions.

Click to buy Mental Health Services KPI Dashboard in Google Sheets
Previous Year Numbers Sheet Tab
Historical data adds context to performance evaluation.
- Enter the previous year’s MTD and YTD data for all KPIs.
- The dashboard then calculates Year-over-Year (YoY) changes and visually highlights performance growth or decline.

Click to buy Mental Health Services KPI Dashboard in Google Sheets
KPI Definition Sheet Tab
This sheet builds the foundation for your KPI structure.
- Enter each KPI’s Name, Group, Unit, Formula, and Definition.
- This ensures that everyone on your team understands what each metric measures and how it’s calculated.
- Transparency here eliminates confusion and keeps everyone aligned on objectives.

Click to buy Mental Health Services KPI Dashboard in Google Sheets
Why Use Google Sheets for Mental Health KPI Tracking?
Google Sheets offers several advantages that make it ideal for managing sensitive healthcare data efficiently:
- Cloud-Based Access: Collaborate securely with teams from multiple locations.
- Automatic Updates: See live results without manual recalculation.
- Customization: Easily add or remove KPIs as your service model evolves.
- Cost-Effective: No need for expensive BI tools or complex software.
- Integration: Import or export data from hospital systems, CSVs, or APIs.
Advantages of the Mental Health Services KPI Dashboard
Better Decision-Making
The dashboard consolidates real-time data, helping managers make quick, evidence-based decisions.
Improved Patient Care
Tracking indicators like satisfaction, therapy completion, and relapse rates highlights where services can improve.
Transparency and Accountability
Everyone — from frontline counselors to administrators — can view shared metrics, promoting responsibility.
Increased Efficiency
Automated updates replace tedious manual calculations, freeing time for patient-focused work.
Performance Benchmarking
Year-over-Year (YoY) comparisons and department-wise KPIs help identify top-performing teams or programs.
Compliance Monitoring
Regular KPI tracking supports adherence to clinical and government reporting standards.
Opportunities for Improvement
While the dashboard is powerful, continuous improvement ensures long-term success.
- Data Quality: Ensure all inputs are validated and verified.
- Security: Implement controlled access for sensitive information.
- Visualization Enhancements: Use conditional formatting and charts to highlight trends better.
- Integration: Connect data with other systems like EHR or HR software.
- Training: Educate staff on interpreting KPIs for more actionable insights.
How to Use the Mental Health KPI Dashboard Step-by-Step
- Open the Dashboard File in Google Sheets.
Enable editing and allow macros if applicable. - Set the Starting Month.
Go to the Actual Numbers Input Sheet, cell E1, and select the first month. - Enter Target Data.
Fill the Target Sheet with monthly and yearly goals for all KPIs. - Enter Actual Data.
Input performance numbers in the Actual Numbers Input Sheet for each KPI. - Add Previous Year Data.
Update the Previous Year Sheet for accurate comparisons. - Review KPI Definitions.
Update or customize KPIs in the KPI Definition Sheet. - Navigate the Dashboard.
Select any month in cell D3 on the Dashboard Sheet to instantly view results.
- YoY Comparison Chart: Display improvement over previous years.
🪴 Best Practices for the Mental Health Services KPI Dashboard
- Keep KPIs Realistic: Avoid overcrowding the dashboard with too many metrics.
- Standardize Data Collection: Use consistent formats across sheets.
- Review KPIs Monthly: Regularly monitor trends and adjust strategies.
- Secure Patient Data: Use Google’s built-in access control and encryption.
- Automate Where Possible: Leverage formulas and dynamic charts for efficiency.
- Engage Stakeholders: Encourage team participation in KPI reviews.
- Document Definitions: Maintain a well-structured KPI Definition sheet for clarity.
This dashboard benefits a wide range of users:
- Hospitals and Clinics: Track treatment outcomes and staff productivity.
- Non-Profit Organizations: Monitor outreach impact and volunteer performance.
- Government Health Agencies: Evaluate public mental health programs.
- Private Practitioners: Track client satisfaction and therapy effectiveness.
- Research Institutions: Collect longitudinal data for studies and reports.
Why Every Mental Health Organization Needs This Dashboard
Mental health services rely on timely insights and data transparency. Without structured monitoring, teams may overlook performance drops or patient feedback trends.
The Google Sheets dashboard provides:
- Instant visibility into operations
- Seamless collaboration across departments
- Historical comparisons to evaluate growth
- Customizability for any organization’s KPIs
It transforms data into actionable insights — empowering organizations to make informed, compassionate, and efficient decisions.
Conclusion
The Mental Health Services KPI Dashboard in Google Sheets is more than a spreadsheet — it’s a comprehensive performance management tool.
By combining automation, visualization, and collaboration, it helps mental health organizations monitor KPIs like patient outcomes, satisfaction, and financial performance with precision.
With its user-friendly design, anyone — from data analysts to therapists — can track progress, identify bottlenecks, and improve service quality.
If your organization values transparency, accountability, and continuous improvement, this dashboard is your ideal solution.
Frequently Asked Questions (FAQs)
- What is the purpose of a Mental Health KPI Dashboard?
It helps healthcare teams track and analyze performance metrics like patient care quality, treatment completion, and staff efficiency, promoting data-driven decisions.
- Why use Google Sheets instead of specialized software?
Google Sheets is free, accessible, cloud-based, and collaborative — perfect for real-time updates and small-to-medium organizations.
- Can I customize the KPIs in the dashboard?
Yes. You can edit or add KPIs directly in the KPI Definition Sheet to match your organization’s focus areas.
- How often should I update the data?
Ideally, update it monthly to keep reports accurate and insights relevant.
- Is it secure to manage healthcare data in Google Sheets?
Yes, when using Google Workspace’s protected access settings. You can control permissions to ensure data privacy.
- Can this dashboard be used offline?
Yes. You can enable offline mode in Google Sheets and sync updates once reconnected.
- Who can benefit from this dashboard?
Hospitals, clinics, NGOs, research centers, and government health departments can all leverage it to enhance mental health service delivery.
Visit our YouTube channel to learn step-by-step video tutorials
Watch the step-by-step video tutorial:
Click to buy Mental Health Services KPI Dashboard in Google Sheets