A Mobile App Performance KPI Dashboard is a tool used by developers, product managers, and marketers to monitor key metrics and evaluate the performance of a mobile application. The dashboard consolidates essential data from various areas such as user acquisition, retention, in-app activities, and revenue generation. By tracking KPIs, teams can assess the app’s success, identify areas for improvement, and make data-driven decisions to enhance performance.
The Google Sheets template is an easy-to-use, customizable dashboard that allows you to input and track your mobile app’s performance metrics. Whether you’re tracking user growth, revenue, or user engagement, this template can help you visualize all of your app’s important data in one place.
Key Features of the Mobile App Performance KPI Dashboard
The Mobile App Performance KPI Dashboard consists of six key worksheets, each designed to help you track and manage different aspects of mobile app performance:
1. Dashboard Sheet Tab
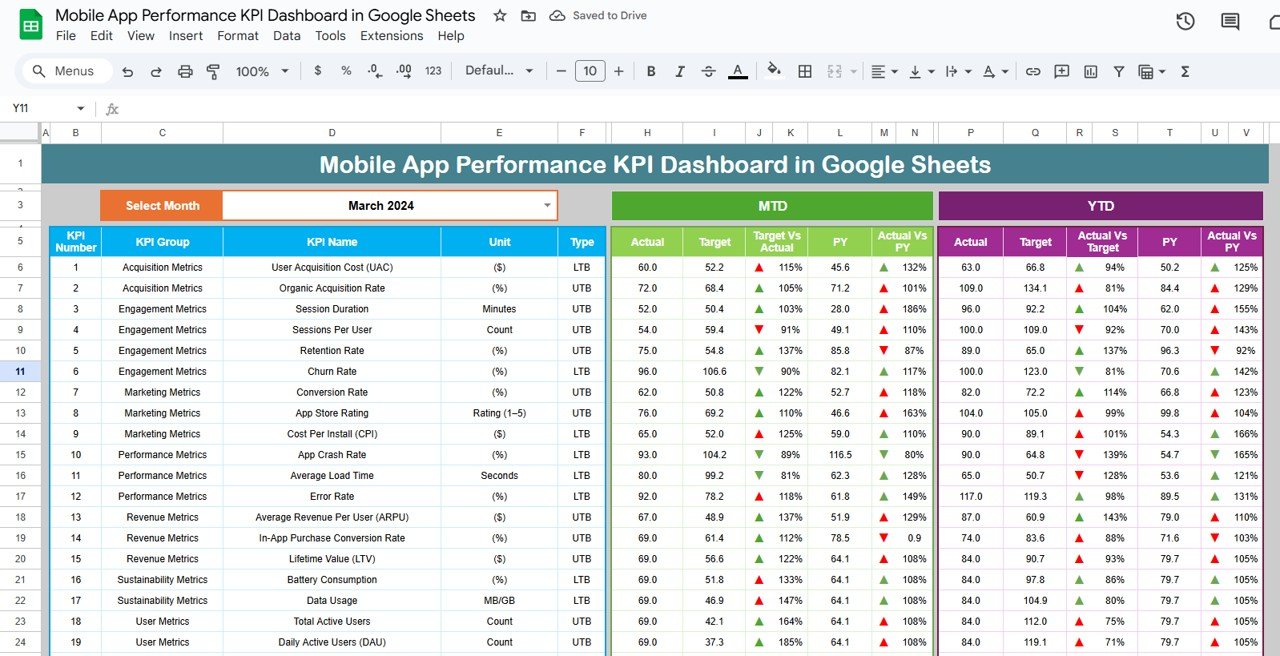
The Dashboard Sheet is the main sheet where all KPIs are displayed and tracked. It includes the following key features:
Month Selection Dropdown (D3): Select the month to view the data for that specific period. The dashboard will update to show MTD (Month-to-Date) and YTD (Year-to-Date) data for that month.
Metrics Displayed:
- MTD Actual, Target, Previous Year Data: Displays the actual data for the selected month compared to the target and previous year’s data.
- YTD Actual, Target, Previous Year Data: Displays the year-to-date data compared to the target and previous year’s data.
Conditional Formatting: Up/d
own arrows are displayed for the Target vs Actual and PY vs Actual comparisons, making it easier to visualize performance trends.
Click to buy Mobile App Performance KPI Dashboard in Google Sheets
2. KPI Trend Sheet Tab
The KPI Trend Sheet is where you can track the performance of each KPI over time:
-
KPI Dropdown (C3): Select the KPI you want to track from the dropdown list, and the sheet will display historical data and trends for that specific KPI.
-
KPI Details: This sheet displays the KPI Group, Unit of Measurement, KPI Type (whether it is “Lower the Better” or “Upper the Better”), the Formula used to calculate the KPI, and its Definition.

Click to buy Mobile App Performance KPI Dashboard in Google Sheets
3. Actual Numbers Sheet Tab
The Actual Numbers Sheet is where you input the actual data for your KPIs:
-
YTD and MTD Input: Enter the actual performance data for the year-to-date (YTD) and month-to-date (MTD) for each KPI.
-
Month Selector (E1): Enter the first month of the year in Range E1, and the data will update accordingly.

Click to buy Mobile App Performance KPI Dashboard in Google Sheets
4. Target Sheet Tab
In the Target Sheet, you input the target values for each KPI:
-
Monthly and YTD Targets: Input the target values for each KPI for both the MTD and YTD performance. This allows you to track whether your app is meeting its goals.

5. Previous Year Number Sheet Tab
This sheet is where you input the previous year’s data:
-
Comparison with Previous Year: Enter the previous year’s data for comparison, allowing you to assess the current year’s performance against historical trends.

Click to buy Mobile App Performance KPI Dashboard in Google Sheets
6. KPI Definition Sheet Tab
The KPI Definition Sheet helps you define each KPI used in the dashboard:
-
KPI Name, Group, Unit: Define the KPI’s name, the group it belongs to (e.g., user engagement, retention), and the unit of measurement.
-
Formula and Definition: Include the formula used to calculate the KPI and provide a detailed definition of each metric for clarity and understanding.

Advantages of Using the Mobile App Performance KPI Dashboard
Click to buy Mobile App Performance KPI Dashboard in Google Sheets
The Mobile App Performance KPI Dashboard provides several advantages to app developers, marketers, and business owners:
-
Comprehensive Overview: The dashboard aggregates all important KPIs in one place, making it easier to track and analyze app performance.
-
Data-Driven Insights: With the ability to track multiple KPIs, the dashboard helps identify trends, areas for improvement, and opportunities for growth.
-
Real-Time Monitoring: The dashboard is updated in real time as data is inputted, allowing you to monitor performance and make timely adjustments.
-
Customizable: The template is fully customizable to suit the specific needs of your app, whether you want to track additional KPIs or change the layout.
-
User-Friendly: The Google Sheets interface makes it easy to use, even for those without advanced technical skills.
Opportunity for Improvement in the Mobile App Performance KPI Dashboard
While the Mobile App Performance KPI Dashboard is an invaluable tool, there are opportunities for further improvement:
-
Automated Data Import: Integrating the dashboard with external data sources (e.g., Google Analytics, Firebase) can automate data entry, saving time and reducing errors.
-
Predictive Analytics: Adding predictive analytics could help forecast trends in app usage, revenue, and retention, allowing for proactive decision-making.
-
Mobile-Friendly Version: Developing a mobile version of the dashboard could allow business owners and marketers to track app performance on the go.
-
Enhanced Reporting: Adding the ability to generate automated reports or graphs based on the data would save time and help teams present insights more effectively.
Best Practices for Using the Mobile App Performance KPI Dashboard
Click to buy Mobile App Performance KPI Dashboard in Google Sheets
To get the most out of the Mobile App Performance KPI Dashboard, follow these best practices:
-
Update Regularly: Ensure that data is updated frequently to keep the dashboard current and reflective of your app’s performance.
-
Track Key Metrics: Focus on the KPIs that are most relevant to your app’s success, such as user retention, revenue, and conversion rates.
-
Leverage Trends: Use the historical data to spot trends and make data-driven decisions to optimize your app’s performance.
-
Share Insights with Your Team: Share the dashboard with your team to foster collaboration and alignment on performance goals.
-
Use Conditional Formatting: Take advantage of the conditional formatting features to quickly visualize areas that need attention (e.g., performance drops).
Conclusion
The Mobile App Performance KPI Dashboard in Google Sheets is an essential tool for any mobile app developer, marketer, or business owner. By tracking key performance metrics like user acquisition, retention, revenue, and customer satisfaction, this dashboard provides the insights needed to optimize app performance and drive growth. With its real-time monitoring, customizability, and user-friendly interface
Click to buy Mobile App Performance KPI Dashboard in Google Sheets
Watch the step-by-step video Demo:
Visit our YouTube channel to learn step-by-step video tutorials