Municipal services are critical to the functioning of local governments, covering a wide range of services like water supply, waste management, street maintenance, and more. To ensure these services are operating efficiently, it’s essential to track key performance indicators (KPIs). A Municipal Services KPI Dashboard in Google Sheets provides an effective tool for tracking these services and ensuring that municipal departments meet their goals.
In this article, we will explore the essential features of a Municipal Services KPI Dashboard, including the KPIs you should track, how to use the dashboard, and its key benefits.
Table of Contents
ToggleWhat is a Municipal Services KPI Dashboard?
A Municipal Services KPI Dashboard is a visual tool that helps local government agencies monitor and evaluate the performance of various municipal services. The dashboard aggregates data on key performance indicators (KPIs), enabling decision-makers to track service delivery, identify issues, and implement improvements where necessary.
Using Google Sheets, this dashboard can be easily customized and updated with real-time data, making it a powerful tool for municipalities of all sizes.
Key Features of the Municipal Services KPI Dashboard
The Municipal Services KPI Dashboard in Google Sheets offers a comprehensive and user-friendly interface to track and visualize important KPIs related to municipal services. The dashboard consists of the following six key worksheets:
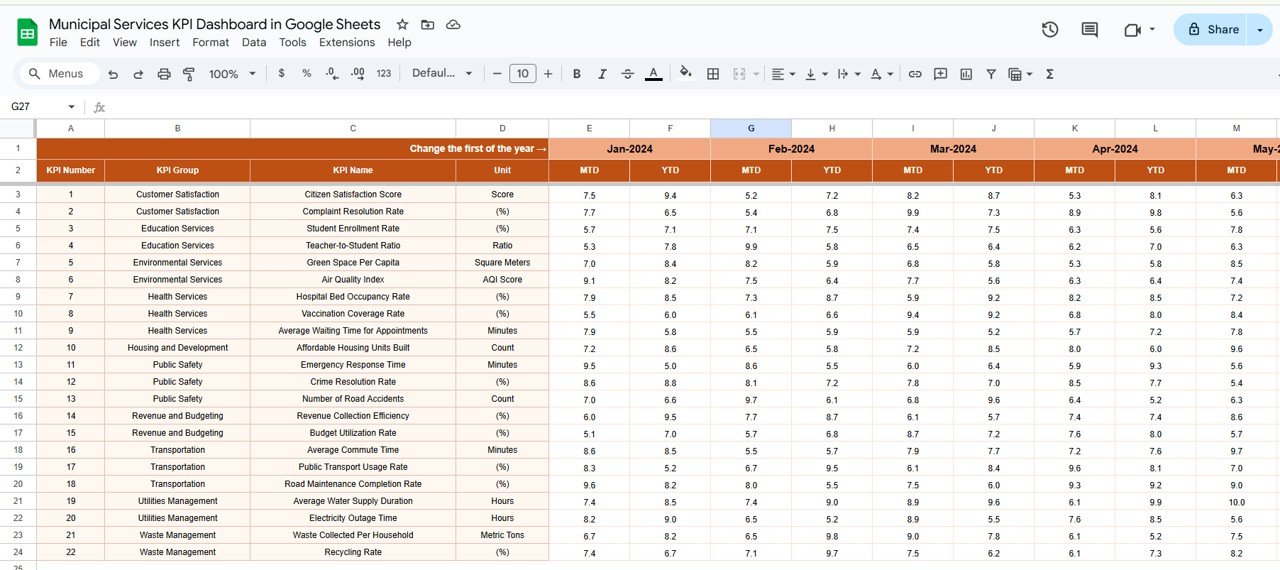
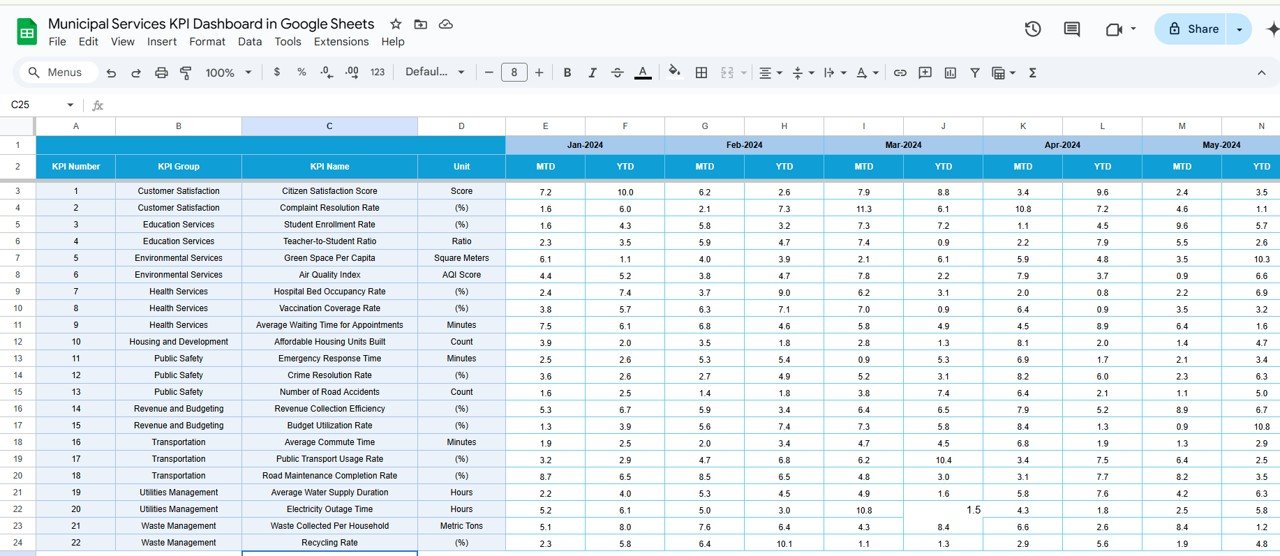
1. Dashboard Sheet Tab
This is the central hub of your KPI dashboard. Here, you can track all key data across various KPIs, showing both Month-to-Date (MTD) and Year-to-Date (YTD) information.
Key features include:
-
MTD Actuals: Displays the actual data for the current month.
-
YTD Actuals: Shows year-to-date performance.
-
Target vs Actual and Previous Year (PY) vs Actual: Visual comparisons to show how the current performance stacks up against targets and the previous year.
-
Conditional Formatting: Up and down arrows indicate performance trends.

Click to buy Municipal Services KPI Dashboard in Google Sheets
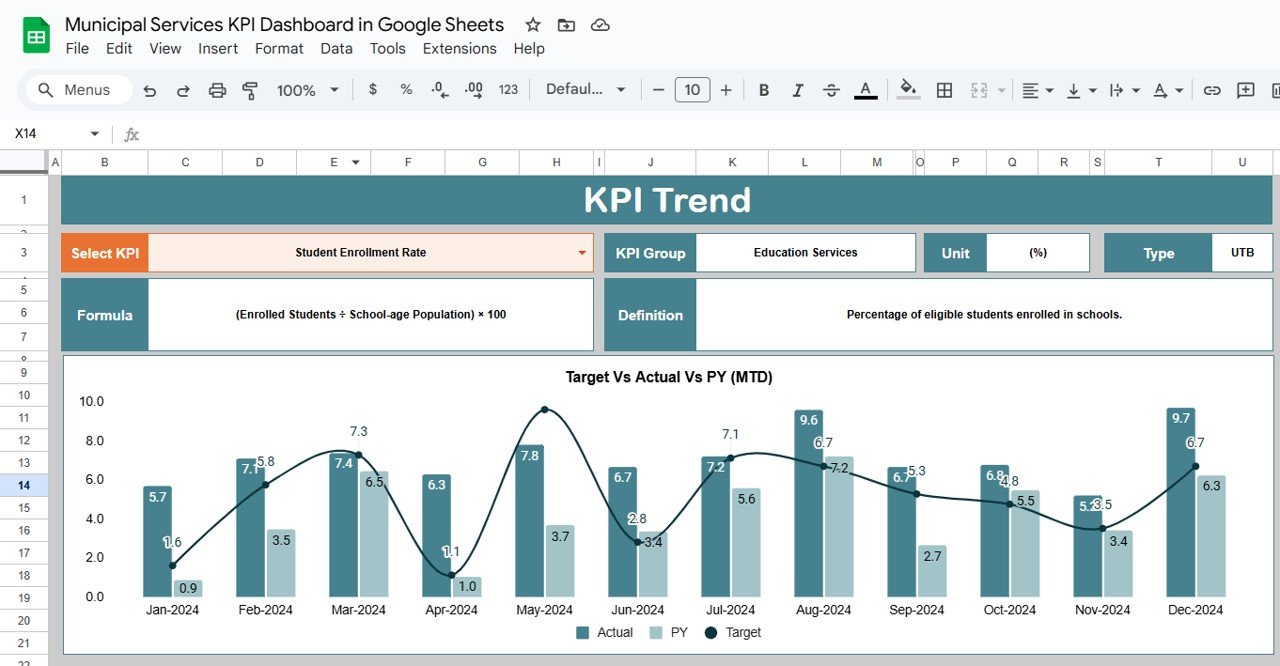
2. KPI Trend Sheet Tab
The KPI Trend Sheet allows users to select a KPI from a drop-down list (available in Range C3) and displays detailed information about it. For the selected KPI, you can view:
-
KPI Group
-
Unit of KPI
-
Type of KPI (Lower the better or Upper the better)
-
Formula for the KPI
-
Definition of the KPI
Click to buy Municipal Services KPI Dashboard in Google Sheets
3. Actual Numbers Sheet Tab
This sheet allows you to enter the actual data for MTD and YTD for a specific month. The data will be updated by selecting the month from Range E1.
4. Target Sheet Tab
In this sheet, you can input the target values for each KPI, both for MTD and YTD, for a specific month. This will help you track whether your municipal services are meeting their targets.
Click to buy Municipal Services KPI Dashboard in Google Sheets
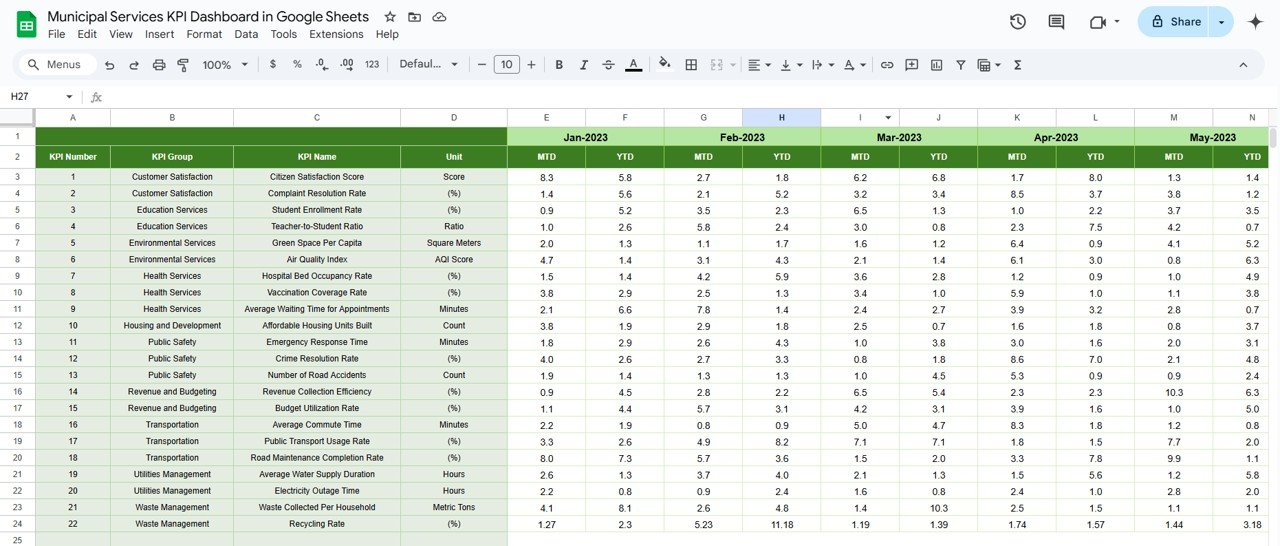
5. Previous Year Numbers Sheet Tab
This sheet is dedicated to entering the previous year’s data. By entering last year’s performance figures, you can compare them with current year data for a Year-over-Year (YoY) analysis.
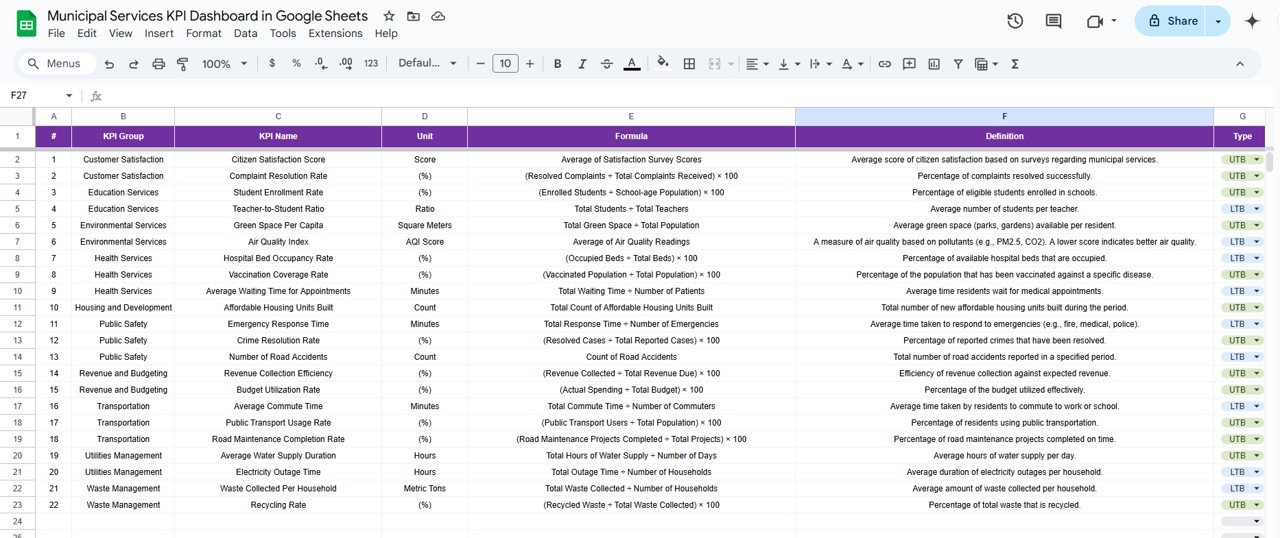
6. KPI Definition Sheet Tab
The KPI Definition Sheet is used to store the names, groups, units, formulas, and definitions of each KPI. It helps ensure consistency and clarity across your entire KPI dashboard.
Advantages of Using a Municipal Services KPI Dashboard
Click to buy Municipal Services KPI Dashboard in Google Sheets
- Enhanced Decision-Making: A well-structured KPI Dashboard allows municipal authorities to make informed decisions based on real-time data. Whether it’s adjusting street maintenance schedules or improving waste management, data-driven decisions lead to better service delivery.
- Improved Transparency and Accountability: The dashboard offers a transparent view of municipal performance, allowing stakeholders to track progress and hold departments accountable for meeting their KPIs. Citizens can also have more confidence in the services provided by local authorities.
- Faster Response to Issues: By tracking key performance indicators, municipal services can quickly identify underperforming areas. For example, if the Emergency Response Time KPI is consistently high, authorities can investigate and take corrective action immediately.
Opportunities for Improvement in Municipal Services
- Address Delayed Waste Collection: If the Waste Collection Efficiency KPI shows low performance, it might indicate delays in waste collection. Improving vehicle maintenance or optimizing the collection schedule could help improve this KPI.
- Enhance Public Satisfaction: The Public Satisfaction Rate KPI can help identify areas where municipal services need improvement. By analyzing feedback, local authorities can address specific issues, whether it’s improving sanitation, road maintenance, or public transportation.
- Improve Emergency Response Time: Tracking Emergency Response Time is essential for ensuring public safety. If the KPI shows a decline in response time, investing in better communication systems or increasing staffing during peak hours may be necessary.
Best Practices for Municipal Services KPI Dashboard
Click to buy Municipal Services KPI Dashboard in Google Sheets
- Regularly Update Data; To ensure the dashboard is accurate and useful, it’s crucial to update the data regularly, ideally monthly. This allows municipal departments to track trends and adjust operations as needed.
- Set Realistic Targets: Setting clear, realistic targets for each KPI helps ensure that the municipality is working towards achievable goals. Regularly review and adjust targets based on performance and available resources.
- Focus on Key Metrics: While tracking many KPIs is important, focusing on the most relevant and impactful metrics ensures that efforts are aligned with the municipality’s strategic objectives.
Frequently Asked Questions
What KPIs should municipalities track for public services?
Key KPIs for municipal services include water supply coverage, waste collection efficiency, street maintenance coverage, public transportation punctuality, and emergency response time.
How can a KPI dashboard improve municipal service delivery?
A KPI dashboard helps track performance, identify issues early, and make data-driven decisions to improve service efficiency and citizen satisfaction.
Can the Municipal Services KPI Dashboard be customized for different cities?
Yes, the Municipal Services KPI Dashboard in Google Sheets is highly customizable. You can tailor it to track the specific KPIs relevant to your city’s needs.
Conclusion
Click to buy Municipal Services KPI Dashboard in Google Sheets
A Municipal Services KPI Dashboard in Google Sheets is a powerful tool for tracking and improving the performance of municipal services. By monitoring critical KPIs such as water supply coverage, waste collection efficiency, and emergency response times, municipalities can make informed decisions, enhance transparency, and improve service delivery. By using this dashboard, local authorities can address performance gaps and ensure that municipal services meet the needs of the community efficiently.
Visit our YouTube channel to learn step-by-step video tutorials
Youtube.com/@NeotechNavigators
Watch the step-by-step video Demo:
Click to buy Municipal Services KPI Dashboard in Google Sheets