In this article, we will explore how to create a Music Industry KPI Dashboard in Google Sheets. This dashboard template is ready to use and designed to track the key performance indicators (KPIs) for the music industry. Below are the key features and functions of the dashboard.
Key Features of the Music Industry KPI Dashboard in Google Sheets
This dashboard includes 6 worksheets designed to help you monitor KPIs in an efficient and organized manner:
Dashboard Sheet Tab
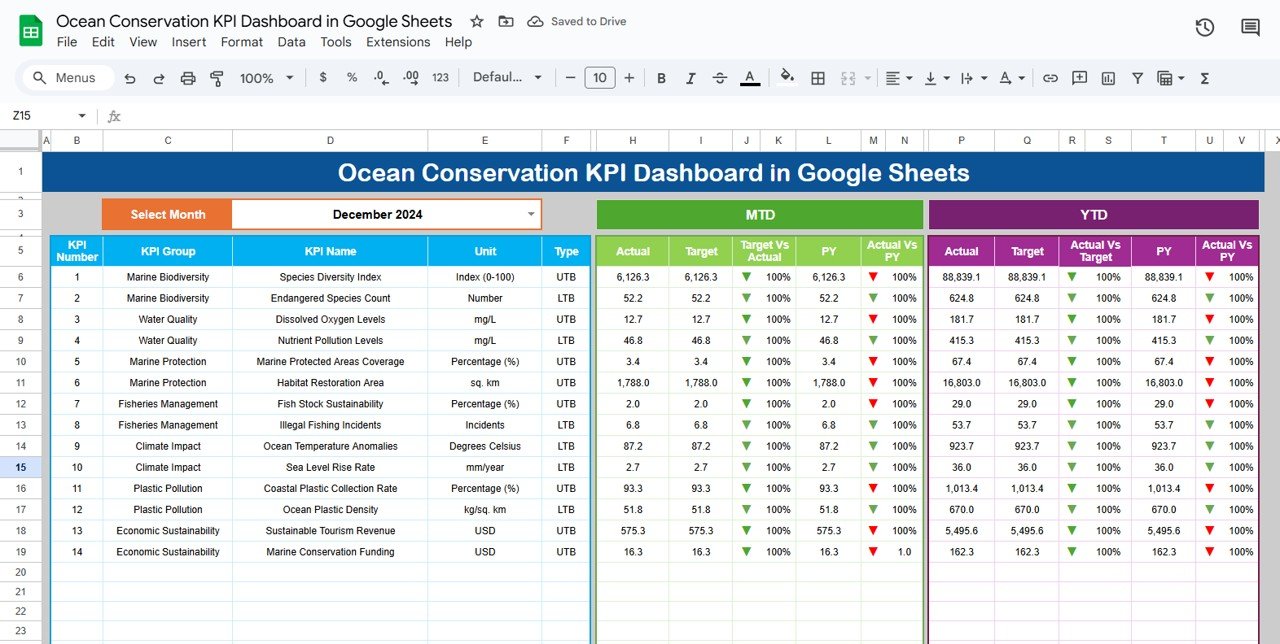
- Month Selection: In cell D3, you can select the month from a dropdown. This automatically updates all data displayed for the selected month.
- MTD (Month-to-Date) and YTD (Year-to-Date): View metrics for both MTD and YTD, including Actuals, Targets, and Previous Year data.
- Target vs. Actual Comparison: Conditional formatting (up/down arrows) is used to display Target vs. Actual and Previous Year vs. Actual performance.

Click to buy Music Industry KPI Dashboard in Google Sheets
KPI Trend Sheet Tab
- KPI Selection: In cell C3, you can select the specific KPI name from a dropdown.
- KPI Group, Unit, and Type: The dashboard will display the KPI Group, the Unit of measurement, and whether the KPI is Lower the Better (LTB) or Upper the Better (UTB).
- Formula and Definition: For each KPI, detailed formulas and definitions are provided to guide you.

Actual Numbers Sheet Tab
Click to buy Music Industry KPI Dashboard in Google Sheets
This tab is used to enter actual numbers for both MTD and YTD for a specific month. You can change the month by selecting it in E1.

Target Sheet Tab
Here, you enter target values for each KPI, including MTD and YTD targets.

Click to buy Music Industry KPI Dashboard in Google Sheets
Previous Year Numbers Sheet Tab
In this sheet, you can enter the Previous Year’s data for comparison with current year performance.

KPI Definition Sheet Tab
This sheet contains a comprehensive list of all KPIs, their respective KPI Group, Unit, Formula, and Definition. It serves as a reference for understanding each KPI in more detail.

Benefits of Using the Music Industry KPI Dashboard
Click to buy Music Industry KPI Dashboard in Google Sheets
- The Music Industry KPI Dashboard provides several benefits to music companies, artists, and managers:
-
Real-Time Data Tracking: The dashboard allows for real-time tracking of music industry performance metrics, enabling quick adjustments to strategies.
-
Data-Driven Decision Making: Having data at your fingertips helps you make informed decisions, whether it’s for marketing, concert planning, or merchandise sales.
-
Efficiency in Monitoring Multiple Metrics: With various KPIs at a glance, you can quickly assess different areas of the business and identify opportunities for growth or improvement.
-
Trend Analysis: The KPI Trend Sheet allows you to track long-term trends, which is crucial for understanding market behavior and artist growth.
Opportunities for Improvement in the Music Industry KPI Dashboard
- To maximize the effectiveness of the Music Industry KPI Dashboard, consider these improvements:
-
Integration with Other Systems: Integrating your dashboard with other business systems (CRM, social media analytics, etc.) can automate data flow, reducing manual input and improving accuracy.
-
Advanced Visualizations: Utilize more advanced charts such as heat maps or 3D charts to present the data more effectively and make trend analysis easier to digest.
-
Mobile Optimization: Optimize the dashboard to be mobile-friendly so that managers can monitor KPIs on the go, especially when traveling for tours or concerts.
-
Incorporate Artist-Specific Metrics: Customize the dashboard for individual artists to track their personal performance metrics, such as album sales, social media engagement, and fan growth.
Conclusion
The Music Industry KPI Dashboard in Google Sheets is a powerful tool for tracking and visualizing key performance indicators. Whether you’re managing concert revenues, streaming performance, or fan engagement, this dashboard can help you make data-driven decisions that will enhance your business strategies. By using the dashboard’s features and tracking the relevant KPIs, you can ensure a higher level of success and continuous improvement in the music industry.
Click to buy Music Industry KPI Dashboard in Google Sheets
Watch the step-by-step video Demo:
Visit our YouTube channel to learn step-by-step video tutorials
Youtube.com/@NeotechNavigators


