Ocean conservation is critical for preserving marine ecosystems and biodiversity. Tracking key performance indicators (KPIs) is essential to ensure that conservation efforts are effective and that progress is being made. The Ocean Conservation KPI Dashboard in Google Sheets is a ready-to-use, interactive tool designed to help organizations monitor and manage key conservation metrics in real time. Whether you are a nonprofit organization, a governmental body, or a private entity involved in marine conservation, this dashboard provides a comprehensive overview of essential performance data.
In this article, we will walk you through the Ocean Conservation KPI Dashboard in Google Sheets, detailing its key features and the KPIs it tracks to help drive effective ocean conservation strategies.
What is the Ocean Conservation KPI Dashboard in Google Sheets?
The Ocean Conservation KPI Dashboard in Google Sheets is a tool that tracks various key performance indicators related to marine conservation efforts. It enables organizations to measure progress toward conservation goals, assess the impact of different initiatives, and make data-driven decisions. This dashboard is built in Google Sheets for easy data entry and real-time collaboration.
The dashboard consists of six main worksheets, each designed to focus on specific aspects of ocean conservation, such as marine biodiversity, pollution reduction, and sustainable fishing practices.
Key Features of the Ocean Conservation KPI Dashboard in Google Sheets
This dashboard is organized into six primary worksheets, each serving a unique function to help you monitor and manage conservation efforts:
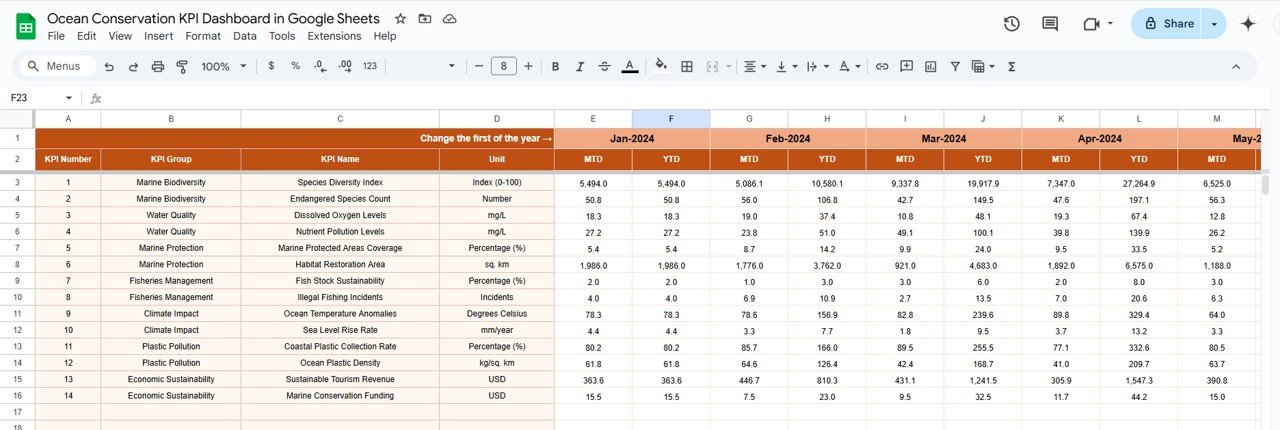
1. Dashboard Sheet Tab
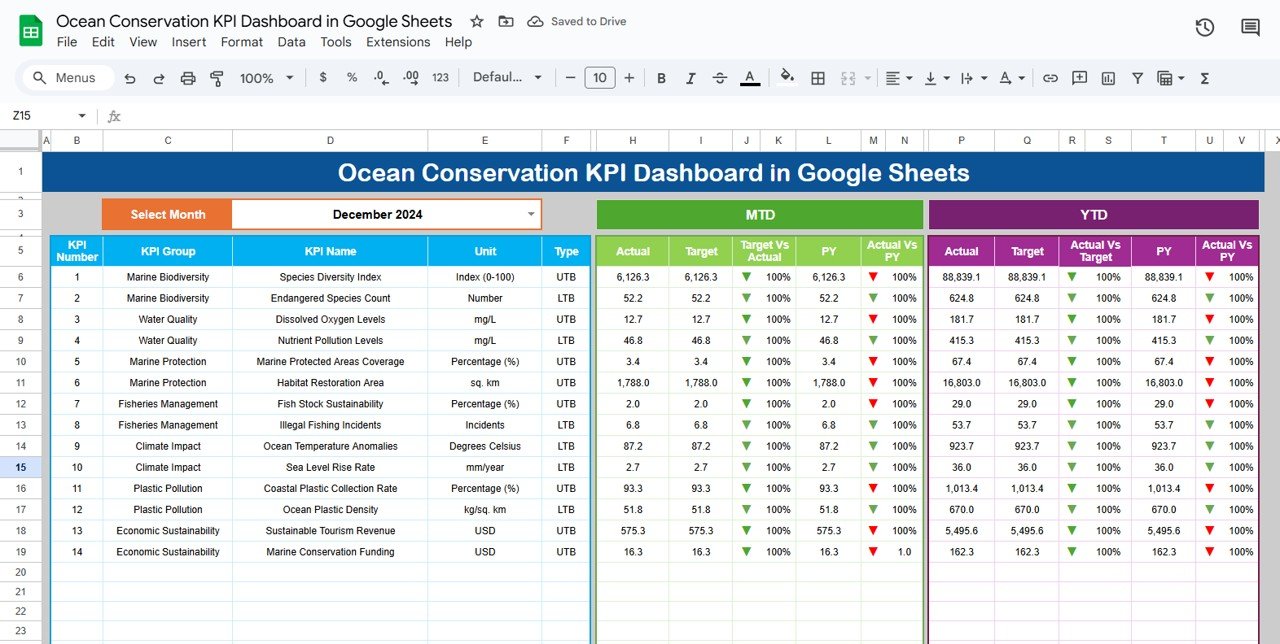
The Dashboard Sheet provides a high-level overview of all KPIs, making it easy to see the current status of your conservation efforts. The features include:
MTD (Month-to-Date) and YTD (Year-to-Date) Metrics:
The dashboard shows both MTD and YTD actual performance, target data, and previous year (PY) data.
- Conditional Formatting: Up/down arrows indicate whether the performance is above or below the target and PY data.
Key Metrics Displayed:
- MTD Actual: The actual performance for the selected month.
- MTD Target: The target value for the selected month.
- PY vs Actual: A comparison of the current month’s data with the same period in the previous year.
- YTD Actual: The cumulative actual performance for the year.
- YTD Target vs Actual: A comparison of the YTD target with actual performance.
Click to buy Ocean Conservation KPI Dashboard in Google Sheets
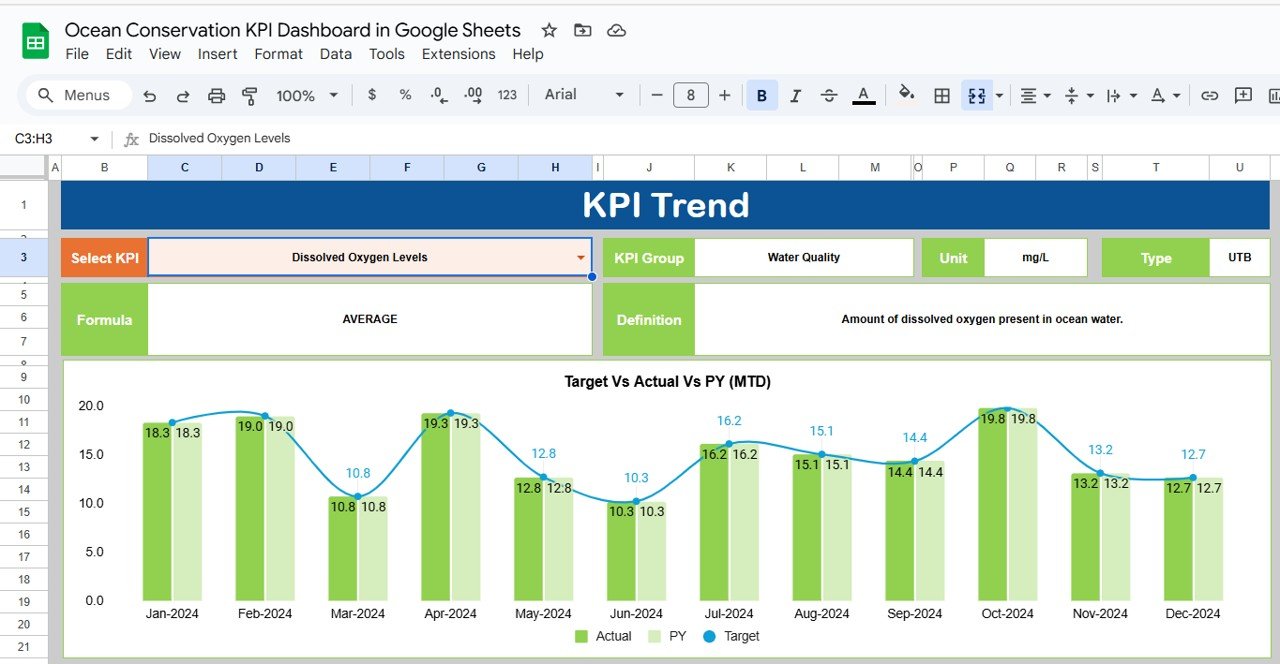
2. KPI Trend Sheet Tab
The KPI Trend Sheet allows you to track the performance of individual KPIs over time, providing insights into long-term trends.
KPI Selection Dropdown:
You can select a KPI name from the dropdown menu in C3, and the sheet will display:
- KPI Group: The category the KPI belongs to (e.g., marine biodiversity, water quality, etc.).
- Unit of KPI: The unit of measurement for the KPI (e.g., tons, number of species, percentage).
- Type of KPI: Whether the KPI is “Lower the Better” or “Upper the Better.”
- Formula of KPI: How the KPI is calculated.
- KPI Definition: The meaning and relevance of the KPI.
Click to buy Ocean Conservation KPI Dashboard in Google Sheets
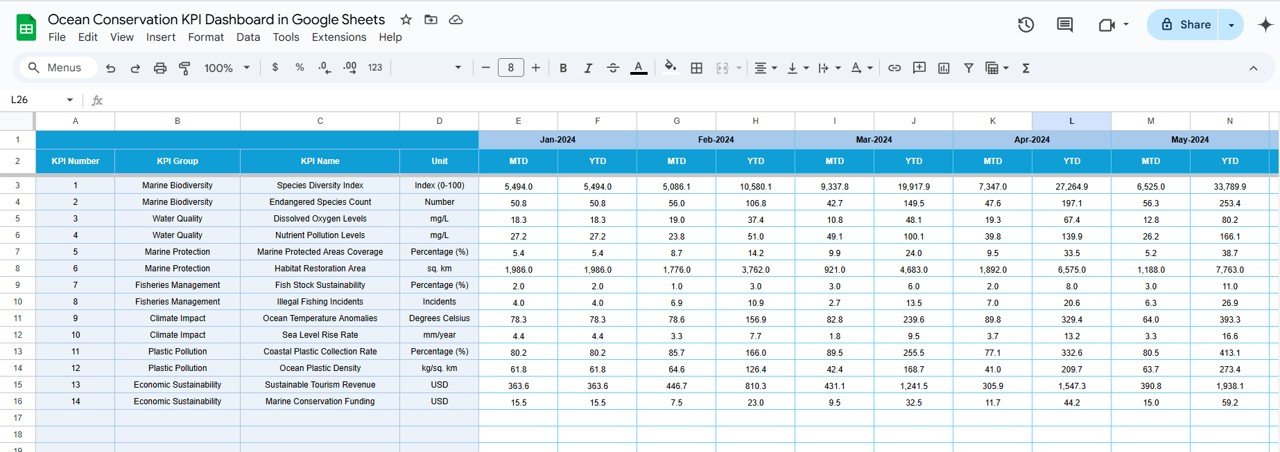
3. Actual Number Sheet Tab
In the Actual Number Sheet, you will enter the actual performance data for MTD and YTD. The dashboard updates automatically based on the data entered in this sheet.
Monthly Data Entry:
You can change the month in E1, and the sheet will update with the relevant data for that month.
4. Target Sheet Tab
The Target Sheet allows you to input target values for each KPI, both MTD and YTD. These targets serve as benchmarks to measure performance against actual results.
- Target Data Entry:
You input the target values for each KPI, ensuring that you have a clear standard for performance.
Click to buy Ocean Conservation KPI Dashboard in Google Sheets
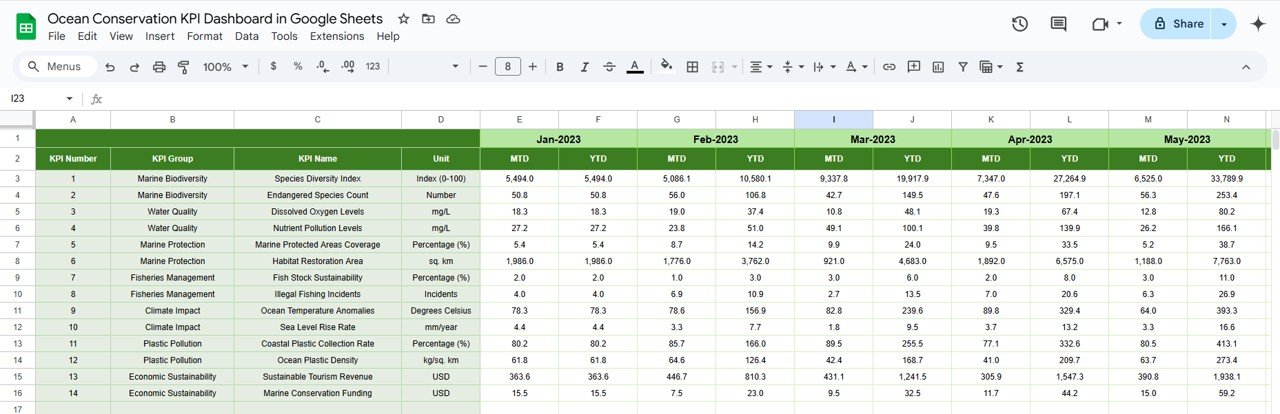
5. Previous Year Number Sheet Tab
The Previous Year Number Sheet stores the data from the previous year for comparison purposes. This allows for year-over-year comparisons to assess progress and identify trends.
-
Previous Year Data Entry:
You enter the previous year’s data to compare it with the current year’s performance.
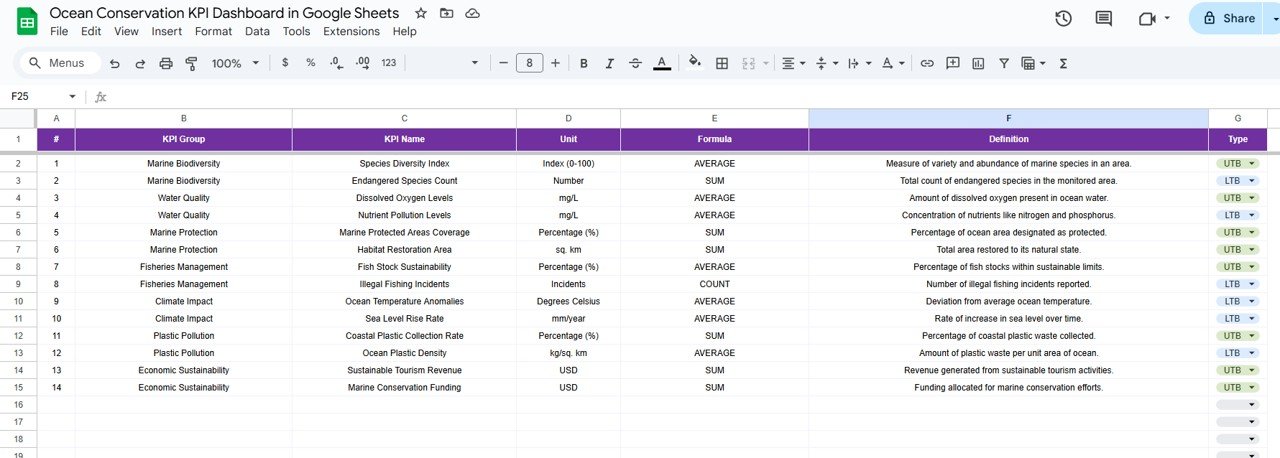
6. KPI Definition Sheet Tab
This sheet provides the detailed definitions for each KPI, ensuring a clear understanding of what each metric tracks and how it is calculated.
-
KPI Definitions:
In this sheet, you define each KPI, including the name, group, unit, formula, and a clear definition of what the KPI tracks.
Click to buy Ocean Conservation KPI Dashboard in Google Sheets
Advantages of Using the Ocean Conservation KPI Dashboard
-
Centralized Data Management: All KPIs related to ocean conservation are tracked in one place, making it easier to manage and monitor your efforts.
-
Real-Time Updates: The dashboard automatically updates as you enter new data, providing an accurate and current view of your conservation performance.
-
Visual Insights: The dashboard’s charts and conditional formatting help visualize trends, targets, and performance gaps at a glance.
-
Customization: The template is fully customizable, allowing you to add new KPIs or modify existing ones based on your specific conservation goals.
-
Informed Decision-Making: The dashboard empowers conservation managers to make data-driven decisions based on the most current and relevant performance metrics.
Best Practices for Using the Ocean Conservation KPI Dashboard
-
Regular Data Updates: Make sure to update the actual data regularly to keep the dashboard current and accurate.
-
Review Targets Frequently: Regularly review and update targets to ensure they align with changing conservation priorities or external factors.
-
Monitor Key Trends: Use the KPI Trend Sheet to track performance over time and identify any potential issues before they become significant.
-
Collaborate Across Teams: Share the dashboard with team members to ensure everyone is aligned with the conservation goals and is taking action based on real-time data.
Frequently Asked Questions (FAQs)
Click to buy Ocean Conservation KPI Dashboard in Google Sheets
1. How do I update the Ocean Conservation KPI Dashboard?
Simply input the latest actual data for each KPI in the Actual Number Sheet, and the dashboard will automatically update.
2. Can I add more KPIs to the dashboard?
Yes, the dashboard is customizable, and you can add more KPIs or modify existing ones based on your specific conservation objectives.
3. How can I compare this year’s performance with last year’s data?
Use the Previous Year Number Sheet to input last year’s data and track year-over-year comparisons.
Conclusion
The Ocean Conservation KPI Dashboard in Google Sheets is an essential tool for tracking and managing ocean conservation efforts. By providing real-time insights into key metrics such as species diversity, waste reduction, water quality, and sustainable fishing practices, this dashboard helps you make informed decisions and optimize conservation strategies. Whether you’re a government agency, nonprofit, or private organization, this template is a valuable resource for achieving your ocean conservation goals.
Visit our YouTube channel to learn step-by-step video tutorials
Youtube.com/@NeotechNavigators
Watch the step-by-step video Demo:
Click to buy Ocean Conservation KPI Dashboard in Google Sheets