Office infrastructure and furniture represent a significant investment for any organization. Chairs, desks, workstations, cabinets, meeting room furniture, and other assets directly impact employee comfort, productivity, and workplace efficiency. However, many organizations struggle to track furniture inventory, costs, condition, and repairs when data remains scattered across multiple spreadsheets.Office Infrastructure and Furniture Dashboard in Google Sheets
This is where an Office Infrastructure and Furniture Dashboard in Google Sheets becomes extremely valuable. This ready-to-use dashboard helps organizations monitor furniture inventory, track costs, analyze condition status, and make data-driven decisions using a single, interactive Google Sheets dashboard.Office Infrastructure and Furniture Dashboard in Google Sheets
In this article, we will explain how the dashboard works, its key sections, charts, search functionality, benefits, and best practices.
What Is an Office Infrastructure and Furniture Dashboard in Google Sheets?
An Office Infrastructure and Furniture Dashboard is a centralized reporting tool designed to track office furniture and infrastructure assets. It provides visibility into quantities, costs, condition, disposal status, repair needs, and trends across locations, departments, categories, and vendors.
Because the dashboard is built in Google Sheets, it offers:
-
Real-time updates
-
Easy collaboration
-
Automatic chart refresh
-
Cloud-based access
-
No additional software cost
This dashboard supports admin teams, facility managers, procurement teams, and finance departments.
Key Features of the Dashboard
Click to Buy Office Infrastructure and Furniture Dashboard in Google Sheets
This is a ready-to-use dashboard with structured analytical sections and a powerful search option. Each section focuses on a different aspect of office infrastructure and furniture management.
Overview Sheet Tab
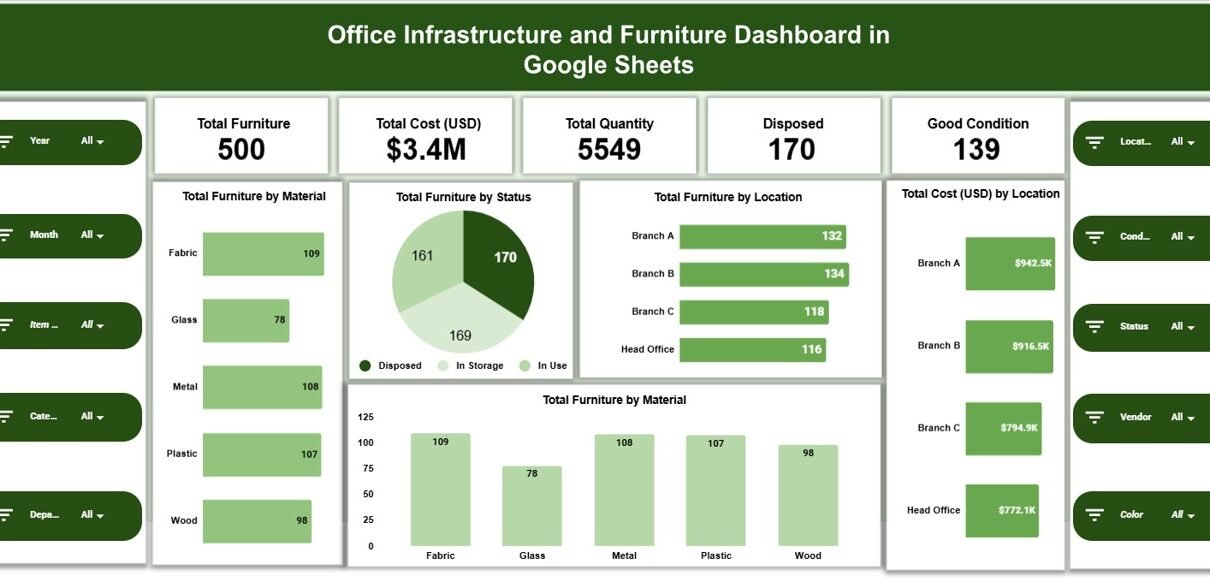
The Overview sheet provides a high-level snapshot of all furniture and infrastructure data.
🔹 KPI Cards
The dashboard displays the following cards:
-
Total Furniture – Total number of furniture items
-
Total Cost (USD) – Total cost of all furniture assets
-
Total Quantity – Overall quantity of assets
-
Disposed – Number of disposed furniture items
-
Good Condition – Number of items in good condition
These cards give instant visibility into asset health and investment value.
Overview Charts
The Overview section includes the following charts:
-
Total Furniture by Material
Shows furniture distribution by material such as wood, metal, plastic, or mixed. -
Total Furniture by Status
Displays condition status like Good, Repair Needed, or Disposed. -
Total Furniture by Location
Highlights how furniture distributes across office locations. -
Total Cost (USD) by Location
Shows cost allocation across locations.
These visuals help management understand asset spread and cost concentration.

Click to Buy Office Infrastructure and Furniture Dashboard in Google Sheets
Category Analysis Section
The Category Analysis section focuses on furniture categories such as chairs, desks, workstations, cabinets, and meeting furniture.
Charts Included:
-
Total Cost (USD) by Category
-
Repair Needed by Category
-
Total Furniture by Category
This analysis helps identify high-cost categories and items requiring frequent repairs.

Click to Buy Office Infrastructure and Furniture Dashboard in Google Sheets
Vendor Analysis Section
The Vendor Analysis section evaluates supplier performance and cost distribution.
Charts Included:
-
Total Cost (USD) by Vendor
-
Repair Needed by Vendor
-
Total Furniture by Vendor
This section helps organizations assess vendor quality, durability, and cost efficiency.

Click to Buy Office Infrastructure and Furniture Dashboard in Google Sheets
Department Analysis Section
The Department Analysis section highlights furniture usage and condition across departments.
Charts Included:
-
Total Cost (USD) by Department
-
Repair Needed by Department
-
Total Furniture by Department
This analysis supports better budgeting and department-level accountability.

Click to Buy Office Infrastructure and Furniture Dashboard in Google Sheets
Monthly Trends Section
The Monthly Trends section tracks changes over time.
Charts Included:
-
Total Cost (USD) by Month
-
Repair Needed by Month
-
Total Furniture by Month
This view helps organizations monitor spending patterns, repair frequency, and asset growth trends.

Click to Buy Office Infrastructure and Furniture Dashboard in Google Sheets
Search Feature – Search by Keyword and Field Name
The dashboard includes a smart search feature that allows users to quickly locate specific records.
You can search by:
- Furniture ID
- Category
- Vendor
- Department
- Location
- Status
By entering a Search Keyword and selecting the Field Name, the dashboard filters matching records instantly.
This feature saves time during audits, inventory checks, and management reviews.

Click to Buy Office Infrastructure and Furniture Dashboard in Google Sheets
Why Organizations Need This Dashboard
Managing office infrastructure manually leads to inefficiencies, budget overruns, and poor asset visibility. This dashboard helps organizations:
-
Maintain accurate furniture inventory
-
Track costs and repairs
-
Improve asset utilization
-
Plan replacements and disposals
-
Support audits and compliance
-
Reduce unnecessary purchases
Centralized visibility improves control and decision-making.
Advantages of the Office Infrastructure and Furniture Dashboard
Click to Buy Office Infrastructure and Furniture Dashboard in Google Sheets
Centralized asset management
All furniture data stays in one place.
Real-time insights
Charts update instantly as data changes.
Better cost control
Cost analysis highlights spending trends.
Improved maintenance planning
Repair tracking reduces asset downtime.
Easy collaboration
Teams work together in Google Sheets.
No technical complexity
Anyone familiar with spreadsheets can use it.
Opportunities for Improvement
Click to Buy Office Infrastructure and Furniture Dashboard in Google Sheets
Organizations can enhance this dashboard by adding:
-
Asset depreciation tracking
-
Maintenance cost history
-
Asset lifecycle status
-
Barcode or asset tag integration
-
Automated alerts for high repair items
-
Budget forecasting
These enhancements increase long-term value.
Best Practices for Using the Dashboard
Click to Buy Office Infrastructure and Furniture Dashboard in Google Sheets
-
Update furniture records regularly
-
Standardize categories, vendors, and statuses
-
Review repair trends monthly
-
Plan replacements using trend data
-
Restrict edit access to authorized users
-
Back up data periodically
Following these practices ensures accurate and reliable reporting.
Conclusion
Click to Buy Office Infrastructure and Furniture Dashboard in Google Sheets
An Office Infrastructure and Furniture Dashboard in Google Sheets provides a clear, structured, and powerful way to manage office assets. It centralizes inventory, tracks costs, monitors condition, and highlights repair needs through interactive visuals. Because it is ready to use and cloud-based, the dashboard simplifies asset management without additional software costs.Office Infrastructure and Furniture Dashboard in Google Sheets
For organizations seeking better control over office infrastructure and furniture investments, this dashboard becomes an essential management tool.Office Infrastructure and Furniture Dashboard in Google Sheets
Frequently Asked Questions (FAQs)
1. Who should use this dashboard?
Facility managers, admin teams, procurement teams, and finance departments.
2. Can it handle multiple office locations?
Yes, it supports unlimited locations.
3. Is the dashboard customizable?
Yes, all fields, charts, and categories can be modified.
4. Does it support audits?
Yes, it provides clear and structured asset records.
5. Can I track disposed assets?
Yes, disposal status is included.
6. Is Google Sheets secure for asset data?
Yes, with proper access controls and permissions.
Visit our YouTube channel to learn step-by-step video tutorials
Youtube.com/@NeotechNavigators
Watch the step-by-step video tutorial:
Click to Buy Office Infrastructure and Furniture Dashboard in Google Sheets