Renovating an office requires careful coordination between departments, contractors, and budgets. To stay on top of every detail—whether it’s cost variance, task progress, or project timelines—you need a centralized view. The Office Renovation Project Dashboard in Google Sheets provides a ready-to-use, data-driven solution to monitor your renovation projects efficiently.Office Renovation Project Dashboard in Google Sheets
In this article, we’ll explain the features, benefits, and best practices of this dashboard, along with how it simplifies project management.
What Is an Office Renovation Project Dashboard in Google Sheets?
An Office Renovation Project Dashboard is a project management tool built in Google Sheets that helps track renovation progress, manage costs, and monitor contractor performance.Office Renovation Project Dashboard in Google Sheets
It brings together key project data, such as budgets, costs, and timelines, into one interactive dashboard. Managers can visualize project status, track departmental performance, and identify areas where costs or timelines deviate from plan—all within Google Sheets.
Key Features of the Office Renovation Project Dashboard
Click to Buy Office Renovation Project Dashboard in Google Sheets
This ready-to-use dashboard includes multiple sheets, each designed to offer detailed insights into your renovation projects.
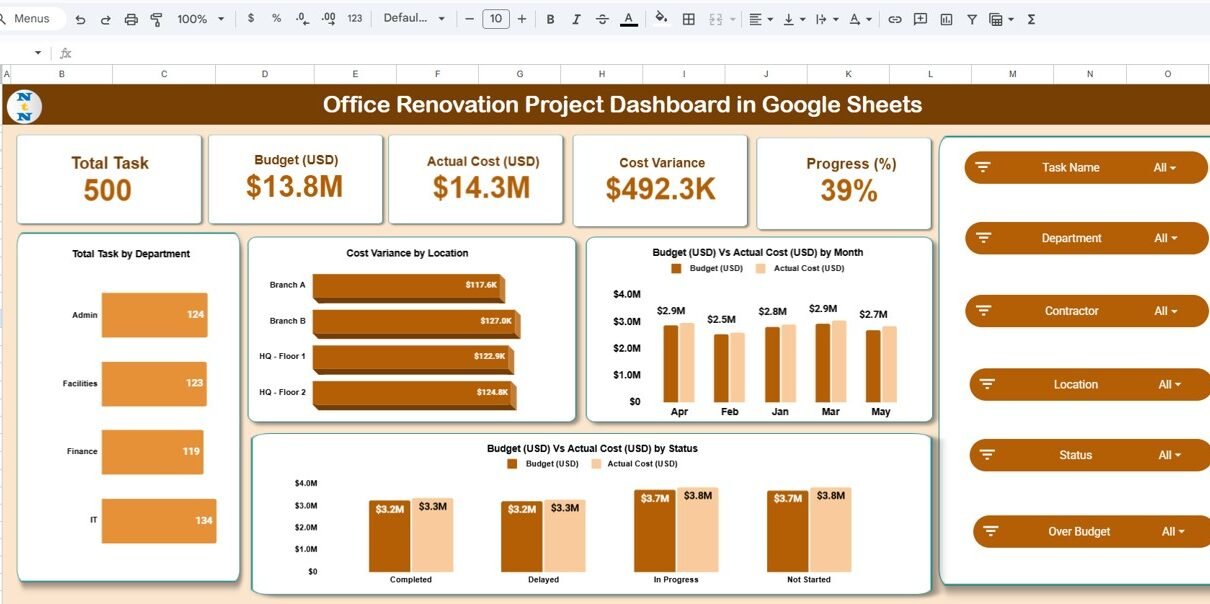
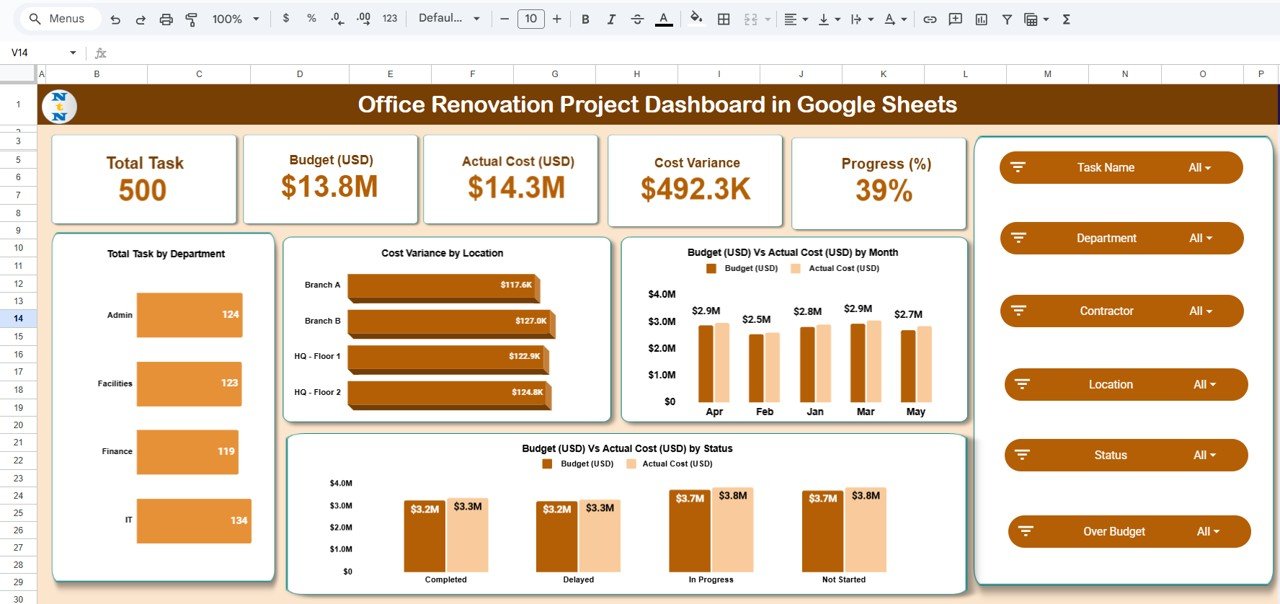
1. Overview Sheet Tab
The Overview Sheet provides a high-level summary of your entire renovation project.
Cards Section:
-
Total Tasks: Shows the total number of renovation tasks planned.
-
Budget (USD): Displays the total allocated project budget.
-
Actual Cost (USD): Shows the amount spent so far.
-
Cost Variance: Highlights the difference between budget and actual cost.
-
Progress (%): Tracks overall project completion percentage.
Charts Section:
-
Total Task by Department: Visualizes task distribution by department.
-
Cost Variance by Location: Displays which locations are over or under budget.
-
Budget vs Actual Cost by Month: Tracks monthly spending against planned budgets.
-
Budget vs Actual Cost by Status: Compares cost performance by project status (e.g., On Track, Delayed, Completed).
Click to Buy Office Renovation Project Dashboard in Google Sheets
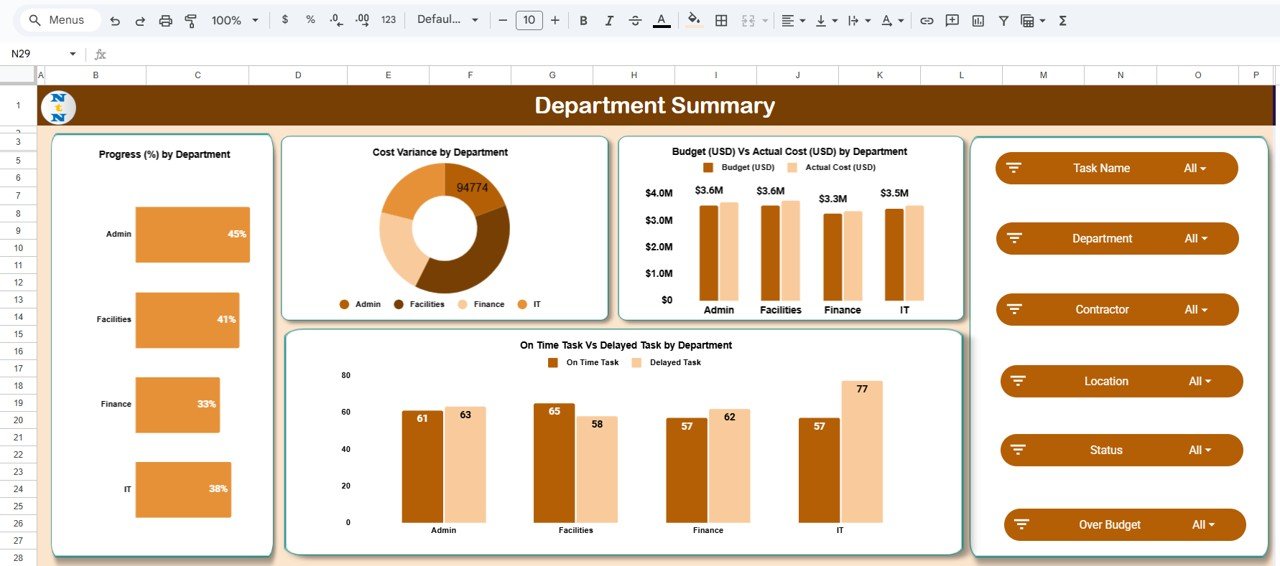
2. Department Summary Sheet Tab
The Department Summary page focuses on performance and spending at the departmental level.
Charts Section:
-
Progress (%) by Department: Measures completion progress by department.
-
Cost Variance by Department: Highlights departments with budget discrepancies.
-
Budget vs Actual Cost by Department: Visualizes cost control across departments.
-
On-Time vs Delayed Tasks by Department: Tracks schedule adherence for each team.
This view helps identify which departments are performing efficiently and which need support or intervention.
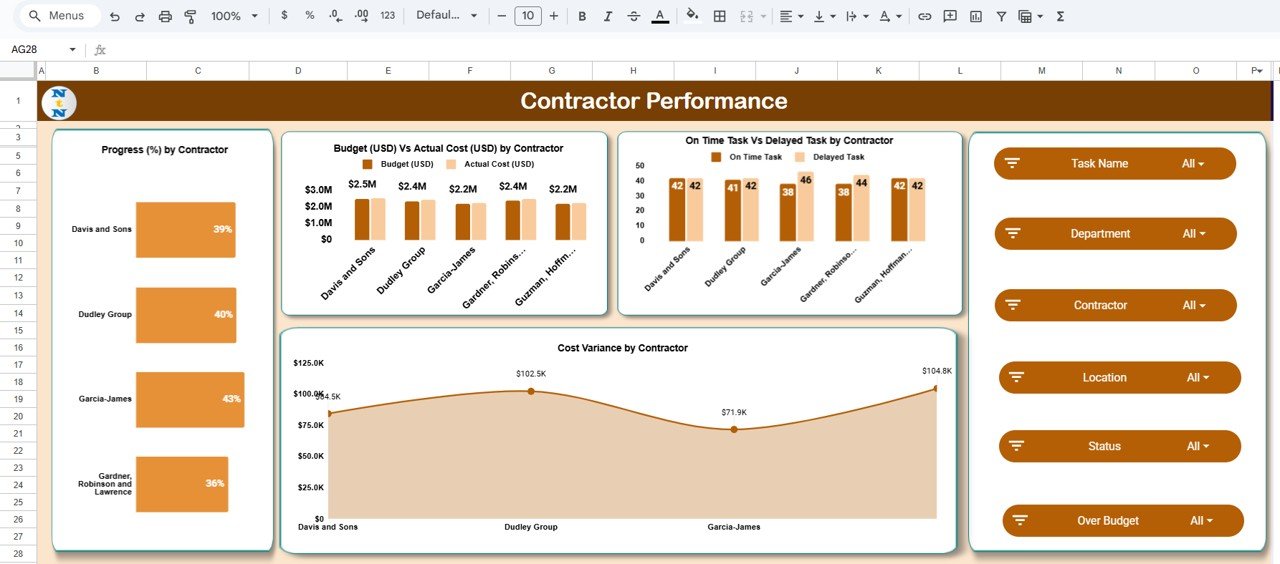
3. Contractor Performance Sheet Tab
This sheet provides insights into how well contractors are performing against budget and schedule expectations.
Charts Section:
-
Progress (%) by Contractor: Tracks each contractor’s overall completion progress.
-
Budget vs Actual Cost by Contractor: Identifies cost control performance.
-
On-Time vs Delayed Tasks by Contractor: Measures delivery punctuality.
-
Cost Variance by Contractor: Highlights contractors who consistently exceed or meet their budgets.
This ensures accountability and helps in selecting reliable vendors for future projects.
Click to Buy Office Renovation Project Dashboard in Google Sheets
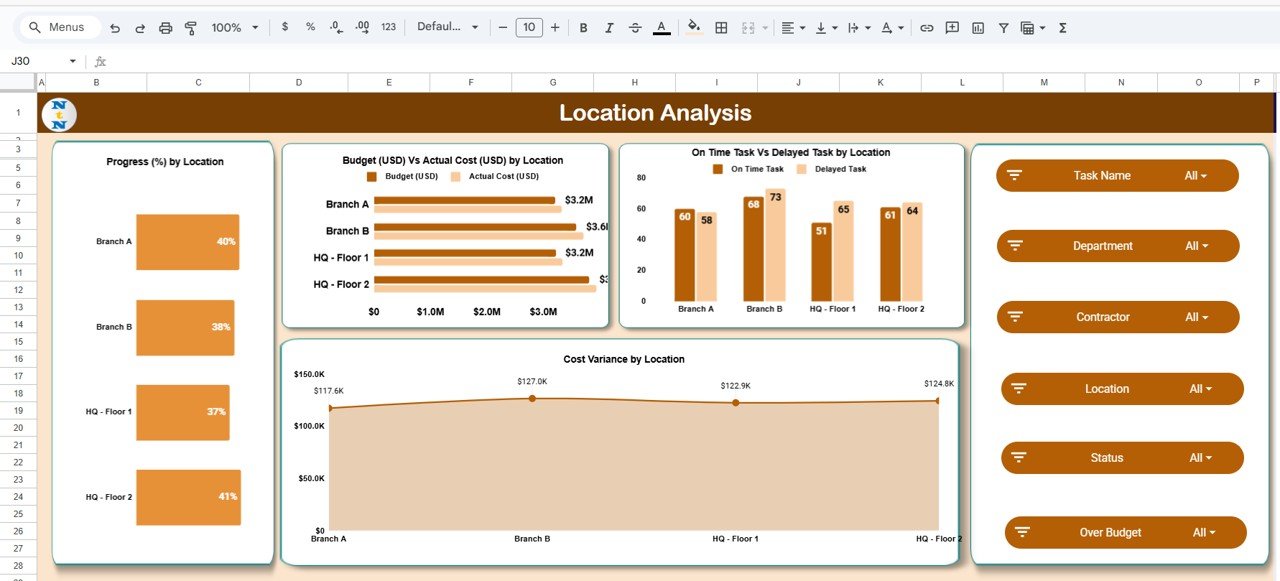
4. Location Analysis Sheet Tab
The Location Analysis sheet provides insights into how renovation projects are performing across different office sites.
Charts Section:
-
Progress (%) by Location: Monitors how quickly work is progressing across offices.
-
Budget vs Actual Cost by Location: Compares cost control between sites.
-
On-Time vs Delayed Tasks by Location: Identifies locations with project delays.
-
Cost Variance by Location: Highlights financial discrepancies across office branches.
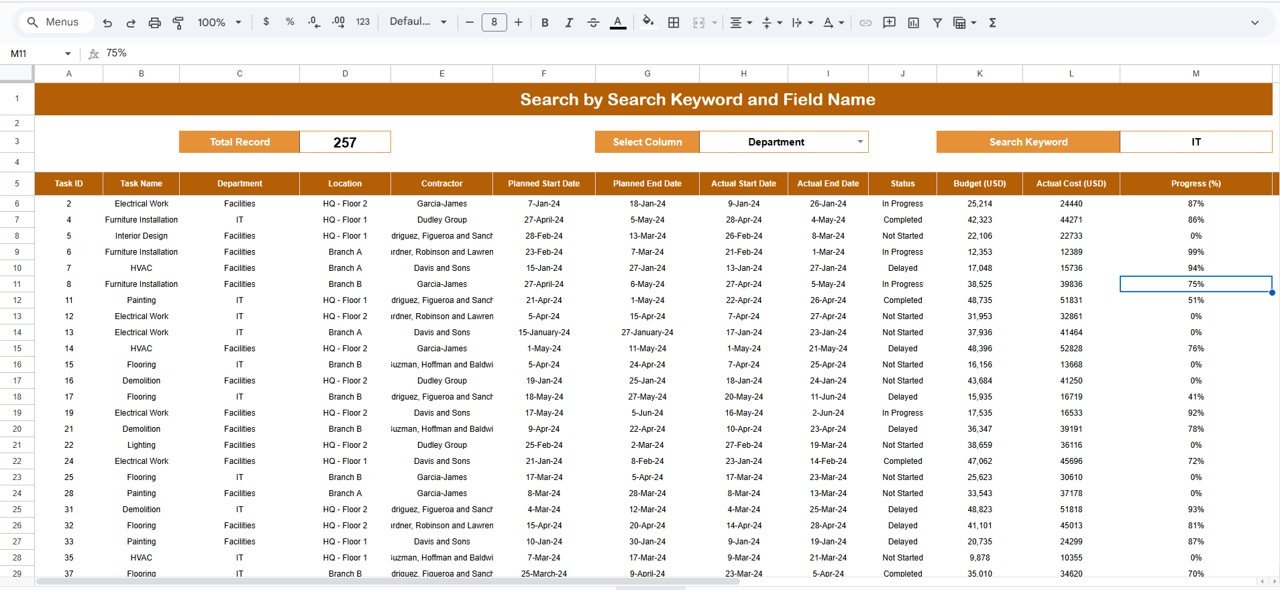
5. Search Function
A built-in search feature allows users to quickly find information by entering a keyword or field name, making it easier to locate data across the entire dashboard.
Click to Buy Office Renovation Project Dashboard in Google Sheets
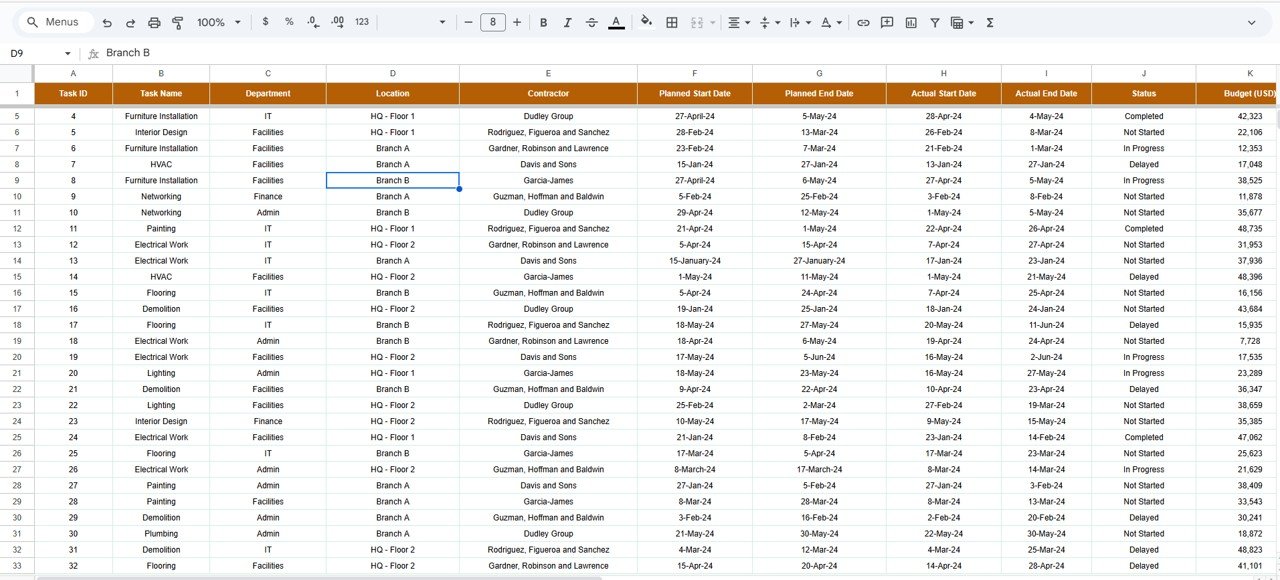
6. Data Sheet Tab
The Data Sheet is the backbone of this dashboard.
-
Acts as the primary database for all project entries.
-
Includes details like task name, department, location, contractor, cost, budget, start and end dates, and status.
-
Updates automatically reflect in all charts and metrics across the dashboard.
Advantages of Using the Office Renovation Project Dashboard in Google Sheets
✅ Centralized Data Management: Keep all project data in one place for better visibility.
✅ Real-Time Monitoring: Automatically updates dashboards when data changes.
✅ Budget Control: Compare actual costs vs. budgets instantly.
✅ Performance Tracking: Identify efficient contractors and departments.
✅ Quick Decision-Making: Visual insights enable faster corrective actions.
✅ Ease of Use: No complex software—just Google Sheets.
Best Practices for Using the Dashboard
Click to Buy Office Renovation Project Dashboard in Google Sheets
-
Update Data Weekly: Regular updates ensure real-time accuracy.
-
Set Clear Targets: Define budgets and progress goals for every department and contractor.
-
Monitor Cost Variance: Keep an eye on departments with consistent overspending.
-
Use Visual Cues: Leverage conditional formatting for quick status identification.
-
Compare Trends: Use monthly charts to analyze project progress over time.
How This Dashboard Helps Project Managers
-
Improves Budget Oversight: Prevent cost overruns by monitoring variances.
-
Enhances Communication: Share one centralized document with all stakeholders.
-
Supports Strategic Planning: Identify which areas need more funding or resources.
-
Boosts Transparency: Ensures accountability across contractors and departments.
-
Simplifies Reporting: Generate summary insights for management instantly.
Frequently Asked Questions (FAQs)
Click to Buy Office Renovation Project Dashboard in Google Sheets
Q1: Can I track multiple projects using this dashboard?
Yes. You can add multiple renovation projects and filter data by location, contractor, or department.
Q2: How do I calculate cost variance?
Cost Variance = (Budget – Actual Cost). Positive variance indicates savings; negative variance shows overspending.
Q3: Can I link this dashboard with other Google Sheets?
Yes, you can import data from other sheets or sources using Google Sheets’ built-in functions.
Q4: Does the dashboard update automatically?
Yes, once you update the data in the Data Sheet, all charts and metrics update in real time.
Q5: Is this dashboard suitable for large projects?
Absolutely. It’s scalable for small office renovations or multi-location upgrades.
Conclusion
The Office Renovation Project Dashboard in Google Sheets is an all-in-one solution for managing renovation budgets, tasks, and performance metrics. Its real-time charts, cost variance analysis, and departmental summaries make it an essential tool for project managers who want to complete renovations on time and within budget.
With this dashboard, tracking progress becomes effortless—giving you control and clarity throughout every phase of the project.
Visit our YouTube channel to learn step-by-step video tutorials
Youtube.com/@NeotechNavigators
Watch the step-by-step video Demo:
Click to Buy Office Renovation Project Dashboard in Google Sheets


