Maintaining workplace security is a top priority for organizations of all sizes. Tracking, analyzing, and resolving security incidents promptly ensures employee safety, compliance, and operational continuity. The Office Security Incident Dashboard in Google Sheets provides a ready-to-use solution to monitor and manage security incidents efficiently.
In this article, we will explore the dashboard’s features, advantages, best practices, and FAQs for effective incident management.
Table of Contents
ToggleWhat Is an Office Security Incident Dashboard?
An Office Security Incident Dashboard is a visual tool that consolidates incident data to track response times, resolution rates, severity, and trends. By using Google Sheets, organizations can:
-
Monitor all security incidents in real time
-
Evaluate response and resolution efficiency
-
Identify high-risk areas or incident types
-
Make data-driven decisions to improve workplace security
This dashboard provides actionable insights while remaining flexible and collaborative for team use.
Key Features of the Office Security Incident Dashboard
Click to Buy Office Security Incident Dashboard in Google Sheets
This dashboard contains three main sheets, each serving a specific purpose:
1. Dashboard Sheet Tab
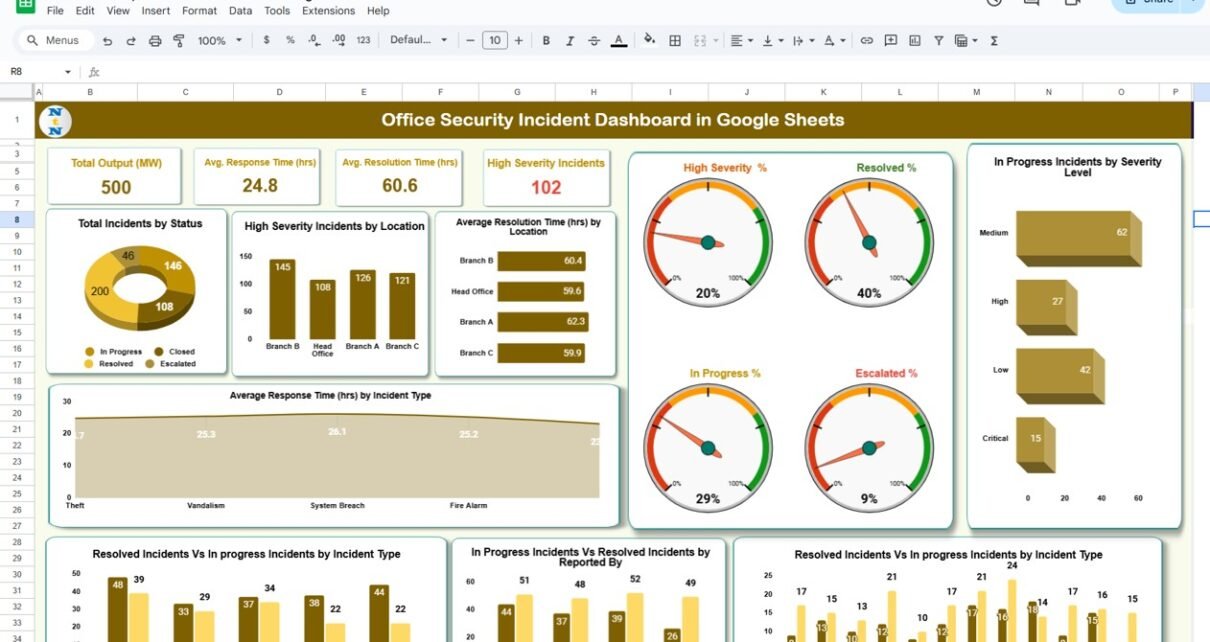
The Dashboard Sheet provides a high-level view of all security incidents using cards and charts:
Cards:
-
Total Incidents: Total number of reported incidents
-
Average Response Time (hrs): Average time to respond to incidents
-
Average Resolution Time (hrs): Average time to resolve incidents
-
High Severity Incidents: Count of critical incidents
Charts:
-
Total Incidents by Status: Visualize open, in-progress, and resolved incidents
-
High Severity Incidents by Location: Identify areas with critical incidents
-
Average Resolution Time by Location: Monitor efficiency of incident resolution per site
-
Average Response Time by Incident Type: Compare response efficiency across incident types
-
High Severity %, Resolved %, In Progress %, Escalated %: Track key incident metrics
-
Resolved vs In-Progress by Incident Type: Analyze resolution trends by type
-
In Progress vs Resolved by Reported By: Evaluate reporting and response performance
This sheet allows security managers to get a complete overview of incident status and performance at a glance.

Click to Buy Office Security Incident Dashboard in Google Sheets
2. Search Sheet Tab
The Search Sheet allows users to find specific incidents efficiently:
-
Search by keyword, incident type, location, or reporter
-
Quickly retrieve incident details without scanning the entire database
-
Supports trend analysis for specific criteria
This feature improves efficiency in managing large volumes of incidents.

Click to Buy Office Security Incident Dashboard in Google Sheets
3. Data Sheet Tab
The Data Sheet serves as the input sheet where all incidents are recorded:
-
Fields include incident ID, type, severity, location, reported by, response time, resolution time, status, and escalation
-
Updating the Data sheet automatically reflects changes on the Dashboard and Search sheets
-
Structured input ensures accurate reporting and reliable analytics
This database is the backbone of the dashboard, allowing comprehensive tracking of all security incidents.

Click to Buy Office Security Incident Dashboard in Google Sheets
Advantages of Using the Office Security Incident Dashboard
-
Centralized Incident Tracking: All security incidents recorded in one location
-
Real-Time Insights: Monitor response and resolution times as new incidents are reported
-
Identify High-Risk Areas: Track high severity incidents by location or type
-
Measure Efficiency: Evaluate team performance using response and resolution metrics
-
Data-Driven Decision Making: Prioritize resource allocation based on trends and severity
-
Collaborative: Multiple team members can update and view the dashboard simultaneously
Best Practices for Using the Dashboard
Click to Buy Office Security Incident Dashboard in Google Sheets
-
Update Data Promptly: Record incidents as soon as they occur to maintain accuracy
-
Segment by Severity and Type: Use filtering to focus on critical incidents
-
Track Trends Over Time: Monitor monthly or quarterly patterns to anticipate security risks
-
Evaluate Team Performance: Review response and resolution metrics regularly
-
Integrate with Security Protocols: Use insights to improve safety measures and policies
How This Dashboard Helps Security Teams
-
Prioritize Critical Incidents: Focus resources on high severity cases
-
Reduce Response and Resolution Times: Identify delays and improve processes
-
Monitor Incident Trends: Spot recurring incidents and potential risk areas
-
Report to Leadership: Provide visual summaries for executive reporting
-
Enhance Workplace Safety: Use insights to implement preventive measures
Frequently Asked Questions (FAQs)
Click to Buy Office Security Incident Dashboard in Google Sheets
Q1: Can I customize the dashboard for my organization?
Yes, you can add custom fields, charts, and KPIs based on your security protocols.
Q2: How often should incident data be updated?
Update the data sheet in real-time or at least daily to maintain accurate dashboards.
Q3: Can I track incidents by location or department?
Yes, the dashboard supports filtering by location, department, incident type, or reporter.
Q4: Does the dashboard track response and resolution efficiency?
Yes, average response and resolution times are calculated and visualized with charts.
Q5: Can multiple security team members update this dashboard?
Absolutely. Google Sheets supports real-time collaboration, allowing multiple users to update incidents simultaneously.
Conclusion
The Office Security Incident Dashboard in Google Sheets provides a comprehensive solution for tracking, analyzing, and resolving security incidents. With real-time metrics, visualizations, and searchable records, it helps security teams improve response times, prioritize critical incidents, and enhance workplace safety.
Visit our YouTube channel to learn step-by-step video tutorials
Youtube.com/@NeotechNavigators
Watch the step-by-step video Demo:
Click to Buy Office Security Incident Dashboard in Google Sheets