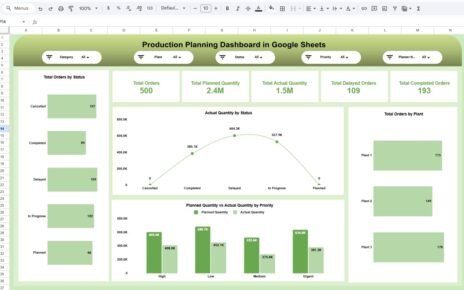
Managing office space efficiently is critical for modern organizations. The Office Space Utilization Dashboard in Google Sheets helps facility managers, HR teams, and operations staff monitor workspace usage, bookings, and costs in one interactive dashboard.
This ready-to-use dashboard allows you to analyze utilization trends, track bookings, and make data-driven decisions to optimize office resources.Office Space Utilization Dashboard in Google Sheets
What Is an Office Space Utilization Dashboard in Google Sheets?
An Office Space Utilization Dashboard is a visual reporting tool that tracks how office spaces are being used. It provides insights into bookings, attendees, costs, preparation times, and ratings, helping organizations identify underused areas and improve efficiency.
Using Google Sheets, this dashboard is collaborative, easy to update, and fully customizable.
Key Features of the Dashboard
Click to Buy Office Space Utilization Dashboard in Google Sheets
This dashboard contains three worksheets, each serving a unique purpose:
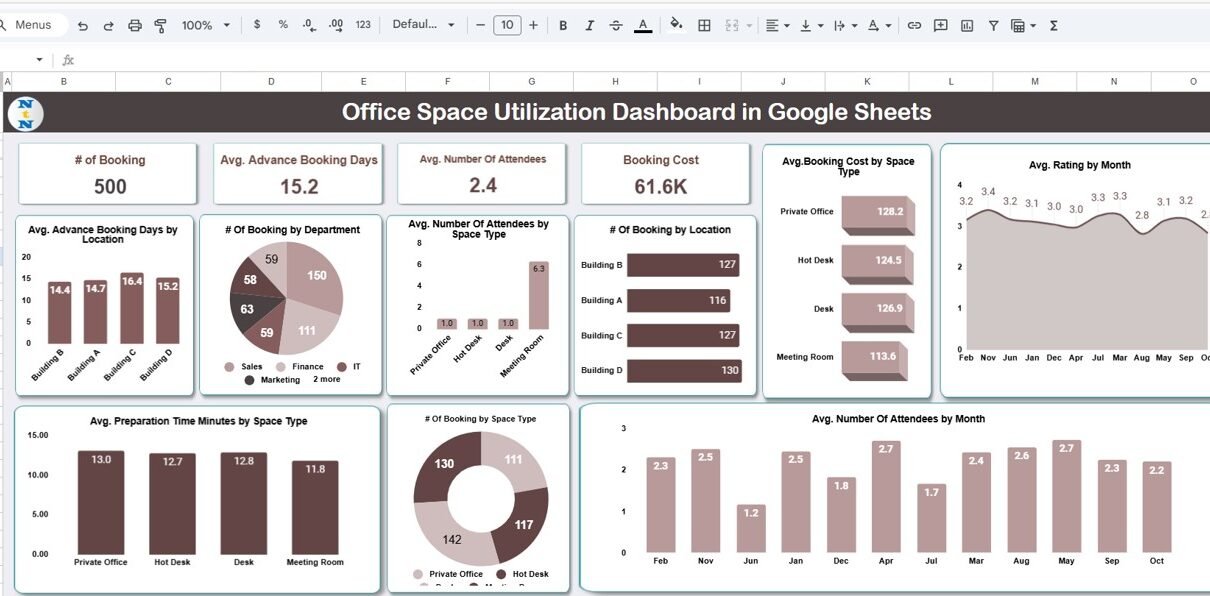
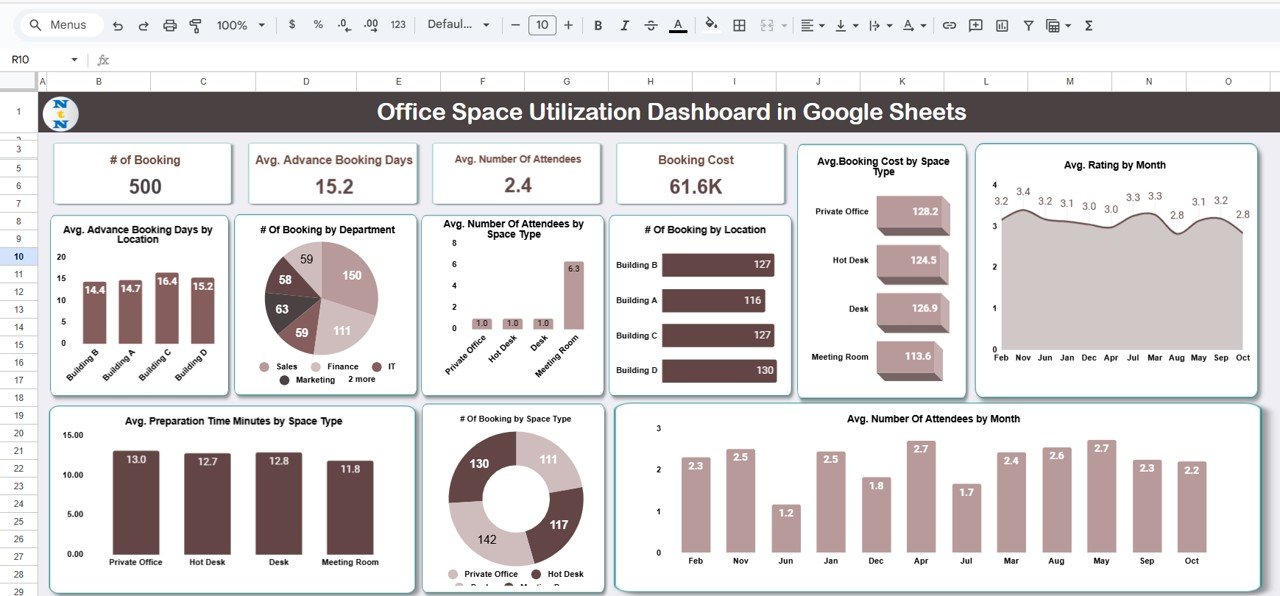
1. Dashboard Sheet Tab
The Dashboard Sheet provides a high-level overview with cards and charts:
Cards:
-
# of Bookings: Total bookings recorded
-
Avg. Advance Booking Days: Average lead time for booking
-
Avg. Number of Attendees: Average number of participants per booking
-
Booking Cost: Average or total booking cost
Charts:
-
Avg. Advance Booking Days by Location: Compare booking lead times across locations
-
# of Bookings by Department: Visualize department-wise space usage
-
Avg. Number of Attendees by Space Type: Compare attendance across different room types
-
# of Bookings by Location: Track popularity of office locations
-
Avg. Booking Cost by Space Type: Monitor cost trends per space
-
Avg. Rating by Month: Track satisfaction trends
-
Avg. Number of Attendees by Month: Monthly attendance trends
-
# of Bookings by Space Type: Analyze space type utilization
-
Avg. Preparation Time (Minutes) by Space Type: Plan staff preparation resources efficiently
Click to Buy Office Space Utilization Dashboard in Google Sheets
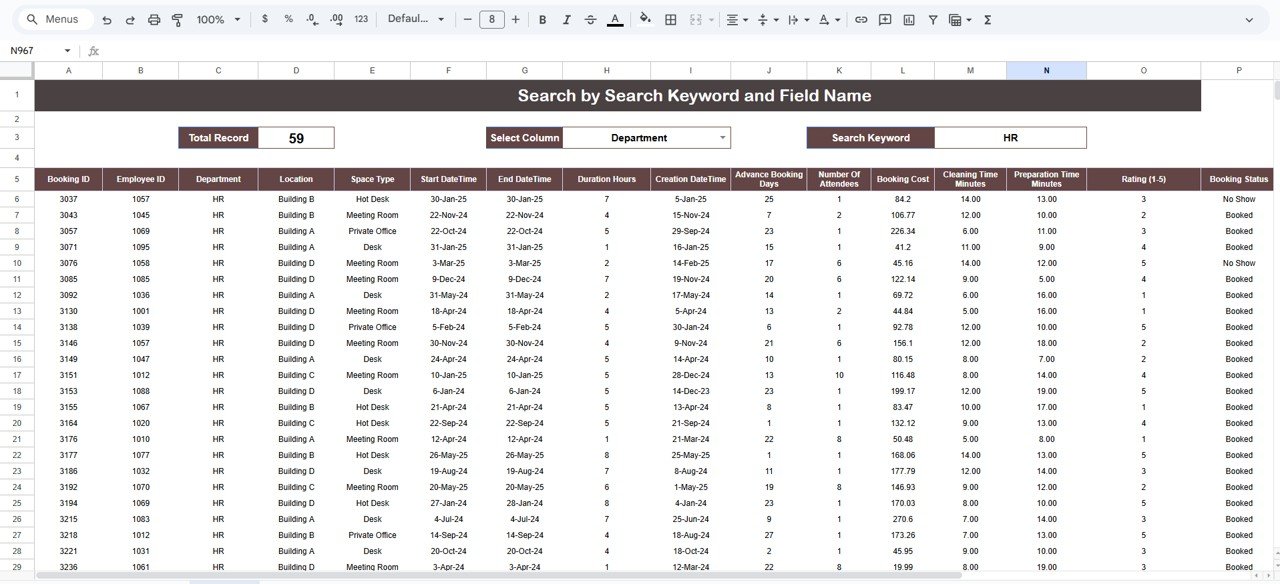
2. Search Sheet Tab
The Search Sheet allows you to filter and search bookings using keywords or field names.
-
Quickly find bookings by location, department, space type, or month
-
Save time when reviewing historical data
Click to Buy Office Space Utilization Dashboard in Google Sheets
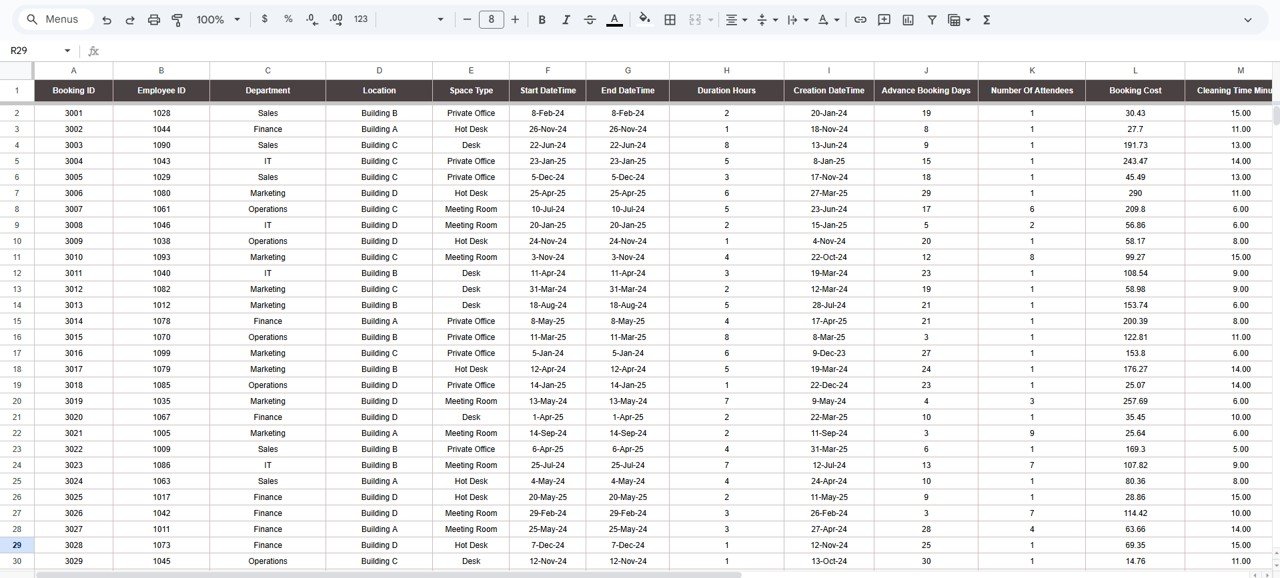
3. Data Sheet Tab
The Data Sheet is the input sheet where all booking details are recorded:
-
Date and time of booking
-
Location, department, and space type
-
Number of attendees, preparation time, and booking cost
-
Feedback or ratings
All charts and cards in the dashboard are automatically updated when new data is entered here.
Click to Buy Office Space Utilization Dashboard in Google Sheets
Advantages of Using the Office Space Utilization Dashboard
-
Centralized Data: All workspace and booking metrics in one place
-
Real-Time Insights: Update the data sheet and see immediate changes in the dashboard
-
Optimize Space Allocation: Identify underutilized rooms and high-demand areas
-
Monitor Costs: Track booking costs and optimize budgeting
-
Plan Resources Efficiently: Allocate staff and preparation time based on utilization trends
-
Collaborative Tool: Google Sheets allows multiple users to access and update data simultaneously
Best Practices for Using the Dashboard
-
Update Data Regularly: Enter booking data promptly to ensure accurate reporting
-
Analyze Trends by Month and Space Type: Identify patterns to improve space usage
-
Monitor Booking Costs: Keep track of cost per booking and adjust budgeting accordingly
-
Evaluate Attendees: Analyze average attendance to optimize room assignments
-
Use Ratings and Feedback: Leverage user feedback to improve booking experience
How This Dashboard Helps Organizations
Click to Buy Office Space Utilization Dashboard in Google Sheets
-
Improve Workspace Efficiency: Allocate rooms based on utilization trends
-
Reduce Costs: Identify underused spaces and optimize operational costs
-
Plan Future Space Needs: Use booking trends to forecast space requirements
-
Enhance Employee Experience: Track satisfaction and adjust spaces accordingly
-
Streamline Operations: Reduce manual tracking with automated dashboards
Frequently Asked Questions (FAQs)
Click to Buy Office Space Utilization Dashboard in Google Sheets
Q1: Can I customize the dashboard for multiple office locations?
Yes, you can add or modify locations in the data sheet to include all offices.
Q2: Does the dashboard automatically update when I enter new bookings?
Yes, all charts and cards update automatically based on data entered in the Data sheet.
Q3: Can I track trends by department or space type?
Absolutely. The dashboard includes charts that segment data by department, space type, and location.
Q4: Is this dashboard suitable for large organizations?
Yes, Google Sheets supports collaborative editing and can handle extensive booking data efficiently.
Q5: Can I track preparation time for each booking?
Yes, the dashboard includes an average preparation time chart for each space type.
Conclusion
The Office Space Utilization Dashboard in Google Sheets is a powerful tool to track and optimize office bookings, attendee numbers, and operational costs. With interactive charts, cards, and search functionality, it helps organizations make data-driven decisions, improve workspace efficiency, and enhance employee satisfaction.
Office Space Utilization Dashboard in Google Sheets
Watch the step-by-step video Demo:
Visit our YouTube channel to learn step-by-step video tutorials
Youtube.com/@NeotechNavigators
Click to Buy Office Space Utilization Dashboard in Google Sheets