Efficient management of office supplies is essential for smooth operations. The Office Supplies Dashboard in Google Sheets provides a ready-to-use solution to monitor requests, track deliveries, manage costs, and analyze usage trends. With this dashboard, office managers, procurement teams, and administrators can streamline supply operations and make data-driven decisions.
What Is an Office Supplies Dashboard?
An Office Supplies Dashboard is a tool designed to monitor and visualize supply requests, deliveries, costs, and quantities. By consolidating this data in Google Sheets, organizations can track trends, optimize procurement, and ensure that employees have the resources they need when they need them.
Key benefits include:
-
Tracking pending and approved requests
-
Monitoring delivered orders and quantities
-
Analyzing total costs by department or category
-
Identifying frequent requesters or departments with high consumption
Key Features of the Office Supplies Dashboard
Click to Buy Office Supplies Dashboard in Google Sheets
This dashboard contains three worksheets, each designed to provide unique insights:
1. Dashboard Sheet Tab
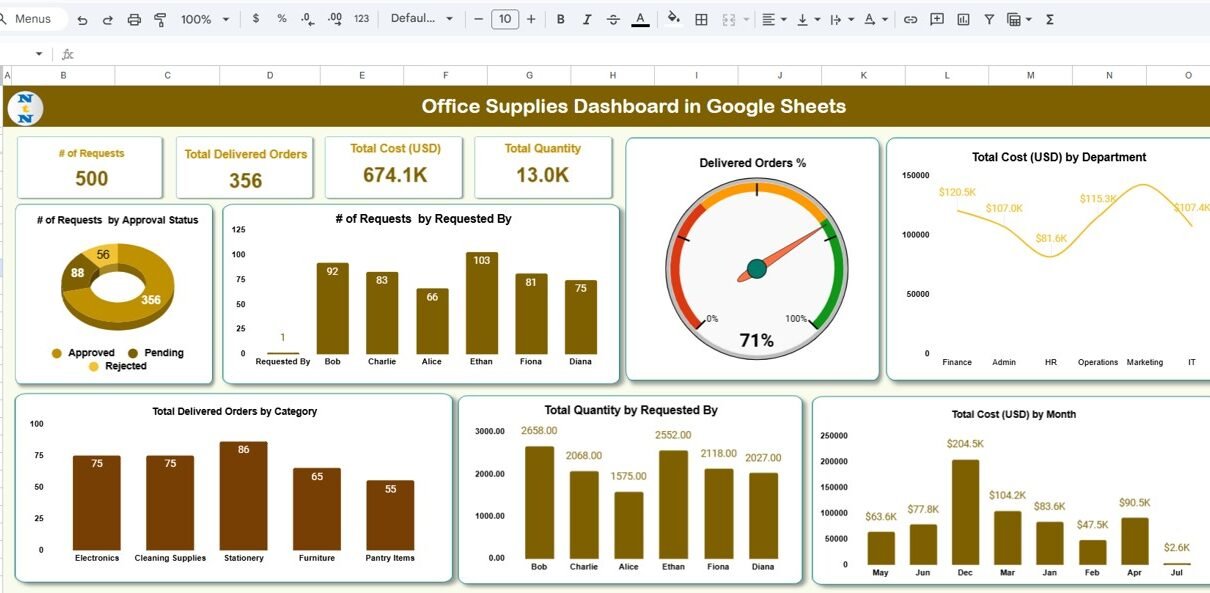
The Dashboard sheet provides a snapshot of all office supplies metrics through cards and charts.
Cards Section:
-
# of Requests: Total requests submitted
-
Total Delivered Orders: Number of orders delivered successfully
-
Total Cost (USD): Total expenditure on office supplies
-
Total Quantity: Total number of items delivered
Charts Section:
-
# of Requests by Approval Status: Visualize pending, approved, or rejected requests
-
# of Requests by Requested By: Identify departments or employees making frequent requests
-
Delivered Orders %: Track the percentage of orders successfully delivered
-
Total Cost by Department: Monitor spending per department
-
Total Cost by Month: Identify trends in supply spending over time
-
Total Quantity by Requested By: Track volume of items requested by individual employees
-
Total Delivered Orders by Category: Analyze orders by supply type or category

Click to Buy Office Supplies Dashboard in Google Sheets
2. Search Sheet Tab
The Search sheet allows users to quickly locate specific requests or items.
-
Search by Keyword and Field Name: Find requests by requester, department, status, or item type
-
Displays total matching records for easy access
This feature helps procurement teams quickly resolve supply queries or track outstanding requests.

Click to Buy Office Supplies Dashboard in Google Sheets
3. Data Sheet Tab
The Data sheet serves as the input sheet for all office supply transactions:
-
Enter each request with details such as request date, requester, department, approval status, item category, quantity, cost, and delivery status
-
Updates in this sheet automatically reflect in the Dashboard and Search sheets
-
Ensures accurate reporting and reliable metrics

Click to Buy Office Supplies Dashboard in Google Sheets
Advantages of Using the Office Supplies Dashboard
-
Centralized Tracking: All requests, deliveries, and costs are in one sheet
-
Visual Insights: Cards and charts make it easy to understand trends at a glance
-
Optimize Procurement: Identify high-consumption items and adjust inventory accordingly
-
Monitor Department Spending: Track costs by department or category for budget management
-
Time-Saving: Automates calculations and reporting for quick analysis
-
Error Reduction: Structured data entry reduces manual errors and missing information
Best Practices for Using the Dashboard
Click to Buy Office Supplies Dashboard in Google Sheets
-
Update Data Regularly: Ensure all new requests and deliveries are entered promptly
-
Segment by Department or Category: Analyze trends to optimize supply management
-
Monitor Cost Trends: Identify months or departments with unusually high spending
-
Use Search Functionality: Quickly locate pending or critical requests
-
Review Delivered Orders: Track fulfillment and ensure no requests are overlooked
-
Customize for Your Organization: Add categories, fields, or KPIs to fit your office needs
How This Dashboard Helps Organizations
-
Track Requests Efficiently: Monitor all requests from submission to delivery
-
Control Costs: Analyze spending patterns and optimize supply orders
-
Improve Accountability: Track department and employee requests accurately
-
Increase Operational Efficiency: Ensure office supplies are delivered on time and in the correct quantity
-
Support Decision-Making: Use visual analytics to plan budgets and future procurement
Frequently Asked Questions (FAQs)
Click to Buy Office Supplies Dashboard in Google Sheets
Q1: Can I customize categories and departments in this dashboard?
Yes, the dashboard is fully customizable to match your organization’s structure and supply types.
Q2: Does the dashboard update automatically?
Yes, data entered in the Data sheet updates all cards, charts, and search results in real-time.
Q3: Can I track pending vs delivered orders?
Absolutely. The Dashboard sheet includes charts like Delivered Orders % and # of Requests by Approval Status.
Q4: Is this suitable for large organizations?
Yes, Google Sheets can handle a significant volume of requests while remaining collaborative and easy to use.
Q5: Can I analyze spending trends over time?
Yes, the Total Cost by Month chart visualizes trends and helps identify high-spending periods.
Conclusion
Click to Buy Office Supplies Dashboard in Google Sheets
The Office Supplies Dashboard in Google Sheets is a comprehensive tool for tracking, analyzing, and managing office supply requests and expenditures. By using cards, charts, and search functionality, organizations can optimize procurement, reduce costs, and improve operational efficiency.
Visit our YouTube channel to learn step-by-step video tutorials
Youtube.com/@NeotechNavigators
Watch the step-by-step video Demo:

