In the world of online education, tracking key performance indicators (KPIs) is essential for understanding student engagement, course effectiveness, and overall performance. The Online Education KPI Dashboard in Google Sheets is a powerful tool designed to help educators, administrators, and institutions track important KPIs, make data-driven decisions, and optimize their online learning platforms.
In this article, we will explore the Online Education KPI Dashboard in Google Sheets, its key features, and how it can help you monitor and improve the performance of your online education programs.
What is the Online Education KPI Dashboard in Google Sheets?
The Online Education KPI Dashboard in Google Sheets is a ready-to-use template designed to track critical KPIs related to online education. These KPIs help evaluate the success of online courses, track student engagement, measure course completion rates, and monitor other essential metrics. With real-time data tracking and visual insights, the dashboard enables educators and administrators to make informed decisions to enhance the learning experience.
The dashboard consists of six main worksheets, each focusing on different KPIs, and provides easy-to-read charts, tables, and performance metrics.
Key Features of the Online Education KPI Dashboard in Google Sheets
The Online Education KPI Dashboard is designed with six key worksheets, each focused on different performance aspects of online education. Here are the key features of the dashboard:
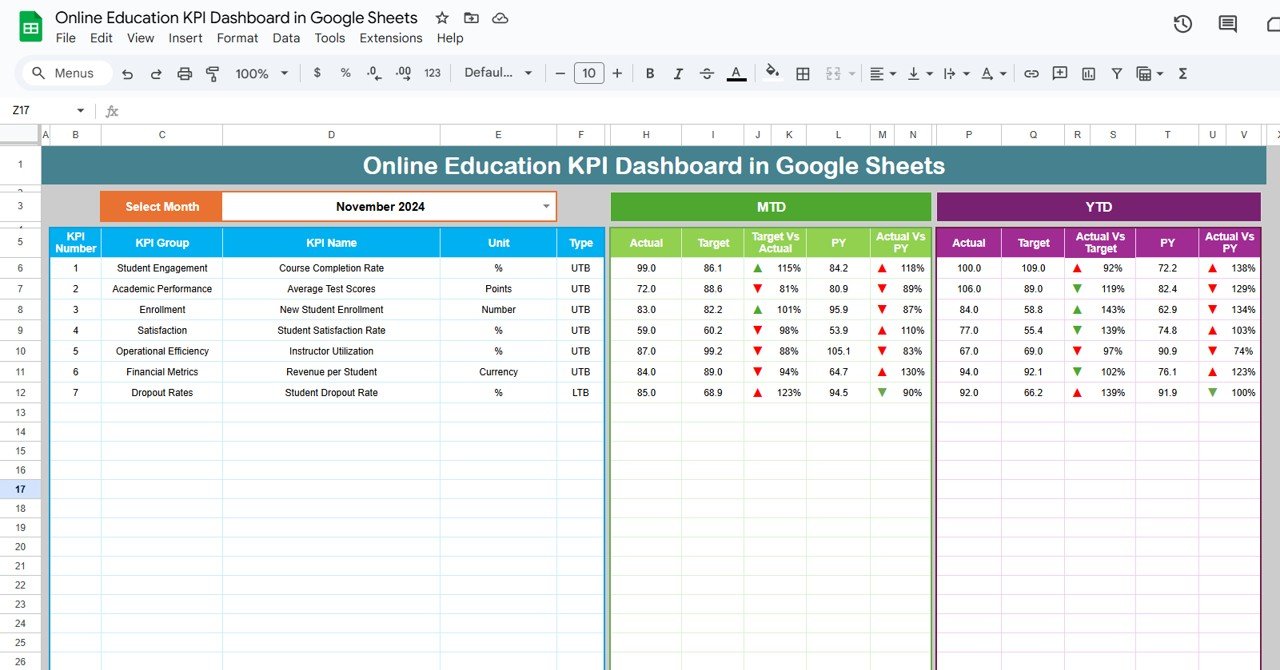
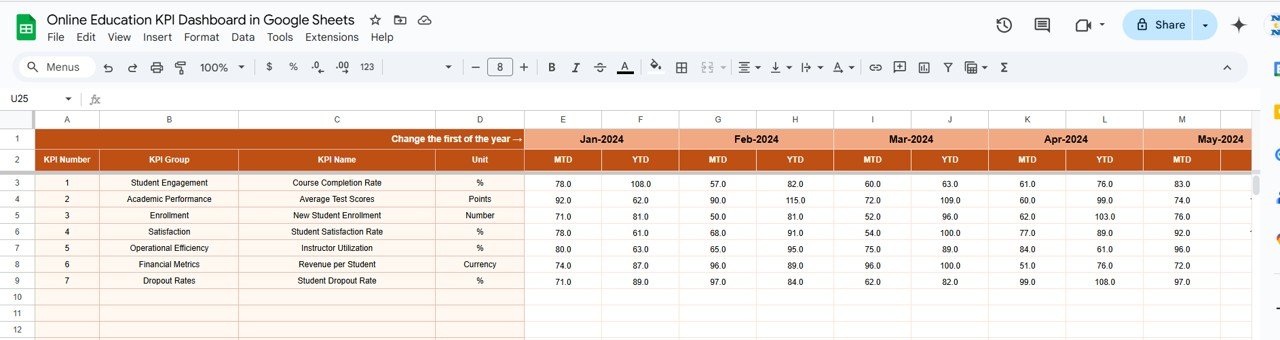
1. Dashboard Sheet Tab
The Dashboard Sheet provides a comprehensive view of all KPIs, allowing you to track performance metrics for the selected month. Key features include:
MTD (Month-to-Date) and YTD (Year-to-Date) Metrics:
- MTD Actual: Displays the actual performance data for the current month.
- MTD Target: Shows the target values for the current month.
- PY vs Actual: Compares the current month’s data with the same period from the previous year (PY).
- YTD Actual: Cumulative data for the year.
- YTD Target vs Actual: Compares the YTD target with actual performance for the year.
- Conditional Formatting: Uses arrows (up or down) to show whether the performance is above or below the target and PY data.

Click to buy Online Education KPI Dashboard in Google Sheets
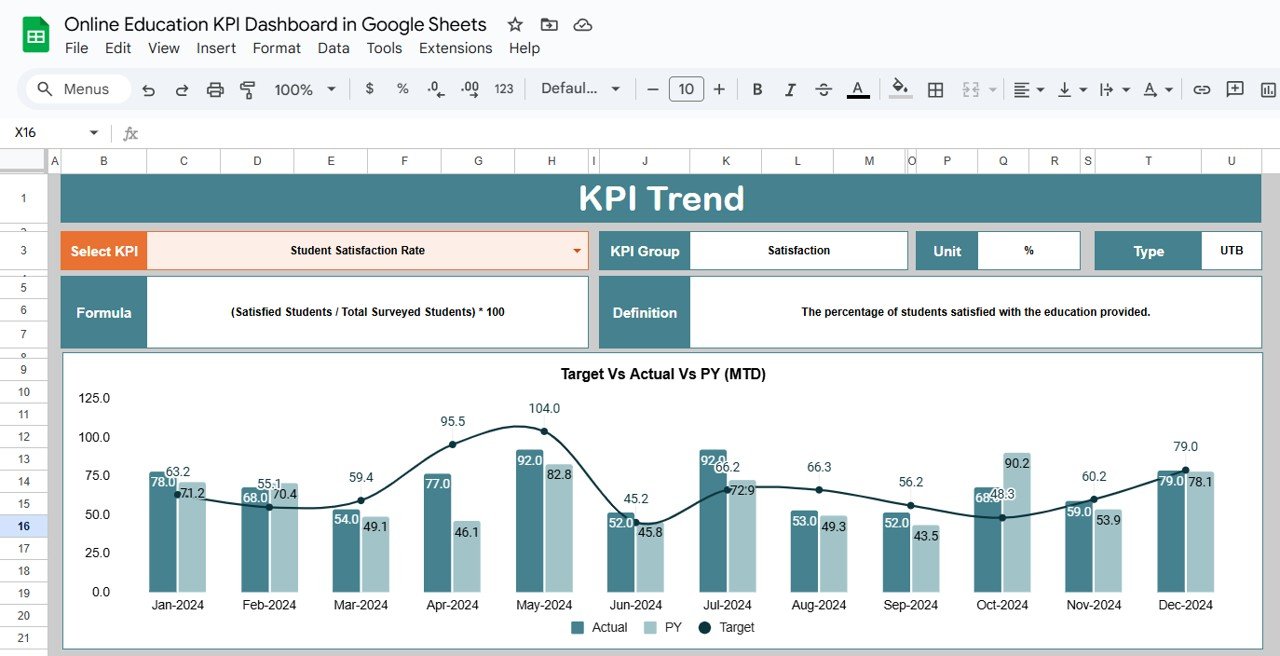
2. KPI Trend Sheet Tab
The KPI Trend Sheet allows you to track individual KPIs over time, helping you spot trends, patterns, and areas for improvement.
KPI Selection Dropdown:
In C3, you can select a KPI, and the sheet will display:
- KPI Group: The category of the KPI (e.g., student engagement, completion rates, course effectiveness).
- Unit of KPI: The unit of measurement for the KPI (e.g., percentage, number of students).
- Type of KPI: Whether the KPI is “Lower the Better” or “Upper the Better.”
- Formula of KPI: The formula used to calculate the KPI.
- KPI Definition: A detailed description of what each KPI measures and why it’s important.
Click to buy Online Education KPI Dashboard in Google Sheets
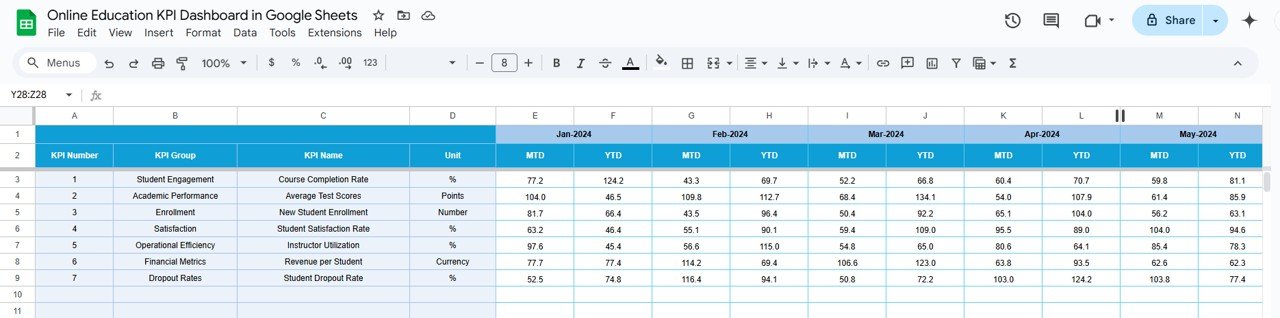
3. Actual Number Sheet Tab
The Actual Number Sheet is where you enter actual data for each KPI, including both MTD and YTD figures. This data updates the dashboard and provides real-time insights.
-
Data Entry:
Enter the actual performance data for each KPI for the selected month (indicated in E1). The dashboard will update automatically with the latest data.
4. Target Sheet Tab
The Target Sheet is where you define the target values for each KPI, both MTD and YTD. These targets are used to compare actual performance against the goals set for the month and year.
-
Data Entry:
Input the target values for each KPI, and compare them with actual performance in the Dashboard Sheet.
Click to buy Online Education KPI Dashboard in Google Sheets
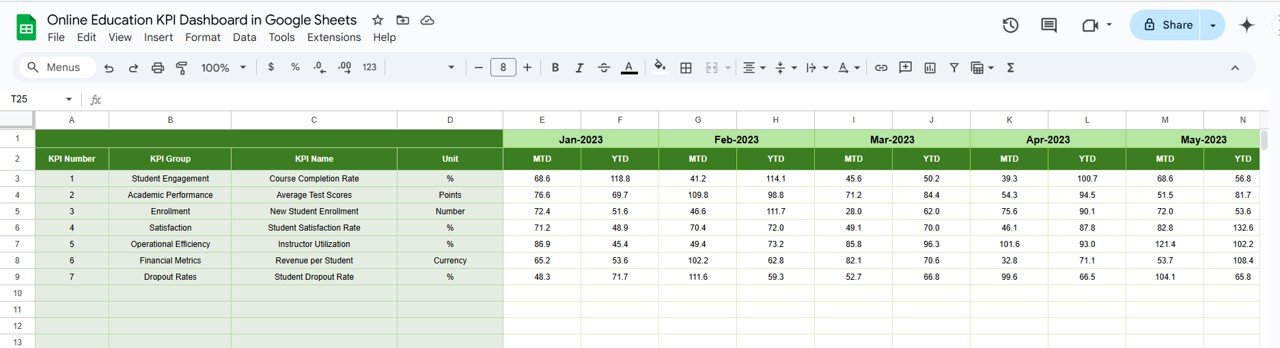
5. Previous Year Number Sheet Tab
The Previous Year Number Sheet stores data from the previous year, allowing you to compare the current year’s performance with historical data.
-
Data Entry:
Enter last year’s data for each KPI to compare performance across years and assess improvements or declines.
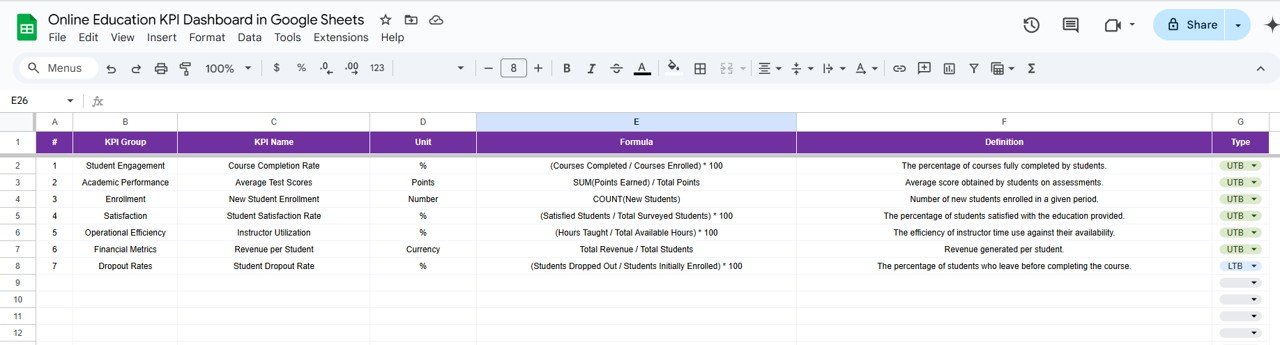
6. KPI Definition Sheet Tab
The KPI Definition Sheet provides a clear and concise definition for each KPI, including its name, group, unit, formula, and the formula used to calculate it.
-
KPI Definitions:
Each KPI is clearly defined with information about the group it belongs to, its unit of measurement, its formula, and a description of what it tracks.
Advantages of Using the Online Education KPI Dashboard
-
Comprehensive Tracking:Track all key KPIs related to online education, from student engagement to course completion rates, in one central location.
-
Real-Time Insights:The dashboard provides real-time updates as you enter new data, ensuring that you always have the latest performance metrics at your fingertips.
-
Customizable to Your Needs:The template can be customized to fit your specific online education goals. You can adjust KPIs, formulas, and data points based on your unique needs.
-
Data-Driven Decision Making:By tracking KPIs like Satisfaction Scores, Engagement Rates, and Completion Rates, you can make informed decisions that improve your online education program.
-
Visual Feedback:The charts and conditional formatting provide clear visual feedback on performance, making it easy to identify areas that need attention.
Best Practices for Using the Online Education KPI Dashboard
Click to buy Online Education KPI Dashboard in Google Sheets
-
Update Data Regularly:Ensure that you enter new data consistently and update the dashboard regularly to reflect the latest performance metrics.
-
Monitor Key Metrics:Focus on critical KPIs such as Engagement Rates, Course Completion, and Satisfaction Scores to ensure that your students are getting the most out of the course.
-
Leverage Insights for Continuous Improvement:Use the insights from the KPI Trend Sheet to identify areas for improvement and adjust your teaching strategies or course materials.
-
Share Data with Stakeholders:Use the dashboard’s visual representation to communicate performance data to stakeholders, including instructors, students, and program administrators.
Frequently Asked Questions (FAQs)
1. How do I update the Online Education KPI Dashboard?
Simply enter the latest data for each KPI in the Actual Number Sheet, and the dashboard will automatically update with the new performance metrics.
2. Can I track multiple courses with this dashboard?
Yes, you can customize the template to track performance for multiple courses or educational programs.
3. How do I compare current performance with the previous year?
Enter last year’s data in the Previous Year Number Sheet to compare performance across years and assess improvements.
Visit our YouTube channel to learn step-by-step video tutorials
Youtube.com/@NeotechNavigators
Watch the step-by-step video Demo:
Click to buy Online Education KPI Dashboard in Google Sheets