In today’s data-driven world, businesses must constantly monitor and optimize their operations to remain competitive. One of the most effective ways to track performance and drive improvements is by using an Operations KPI (Key Performance Indicator) Dashboard. This powerful tool allows organizations to keep track of key metrics, assess their progress toward goals, and make informed decisions. In this article, we will walk you through the Operations KPI Dashboard in Google Sheets, highlighting the essential features, KPIs, and best practices for getting the most out of this dashboard.
Table of Contents
ToggleWhat is an Operations KPI Dashboard?
An Operations KPI Dashboard is a visual representation of key metrics that measure the performance of various aspects of a company’s operations. This dashboard helps businesses track critical operations such as production efficiency, process optimization, resource allocation, and customer satisfaction. By using a centralized dashboard in Google Sheets, organizations can access real-time data, make quick adjustments, and ensure that their operations align with business objectives.
Key Features of the Operations KPI Dashboard in Google Sheets
Click to buy Operations KPI Dashboard in Google Sheets
The Operations KPI Dashboard template in Google Sheets is designed to provide users with a comprehensive and easy-to-use tool for tracking and optimizing operations. Below are the key features that make this template an invaluable asset:
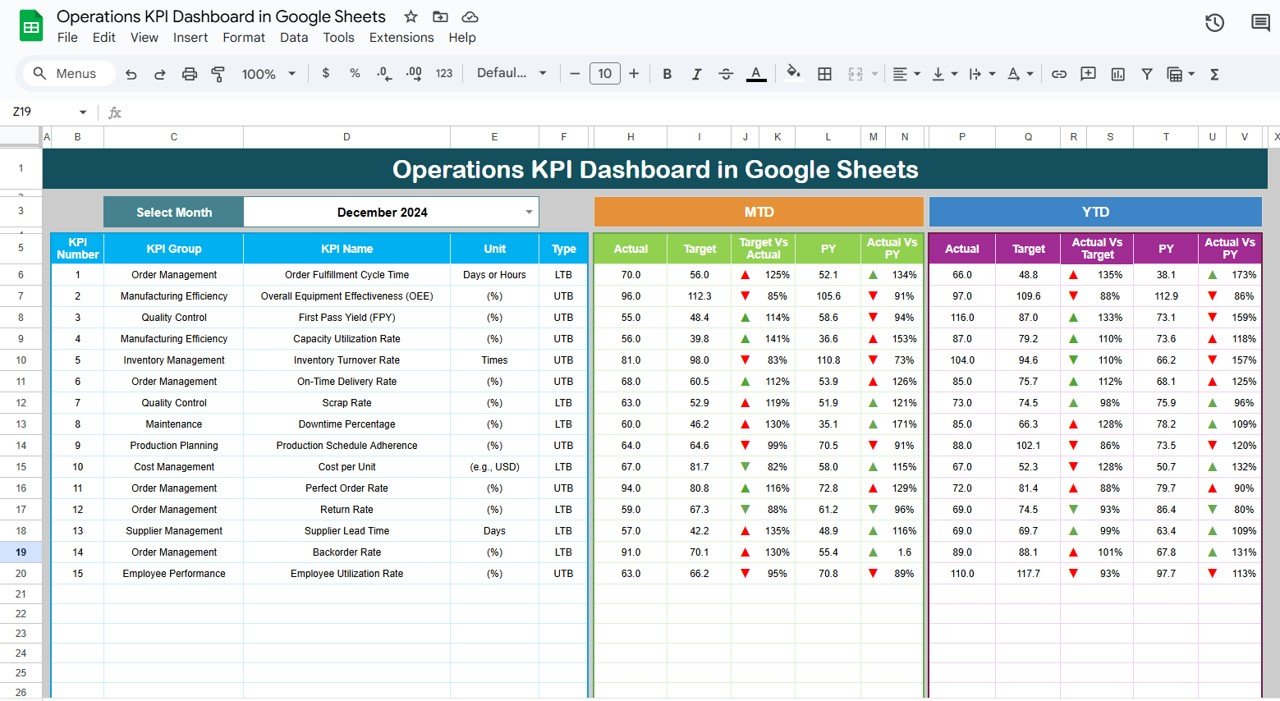
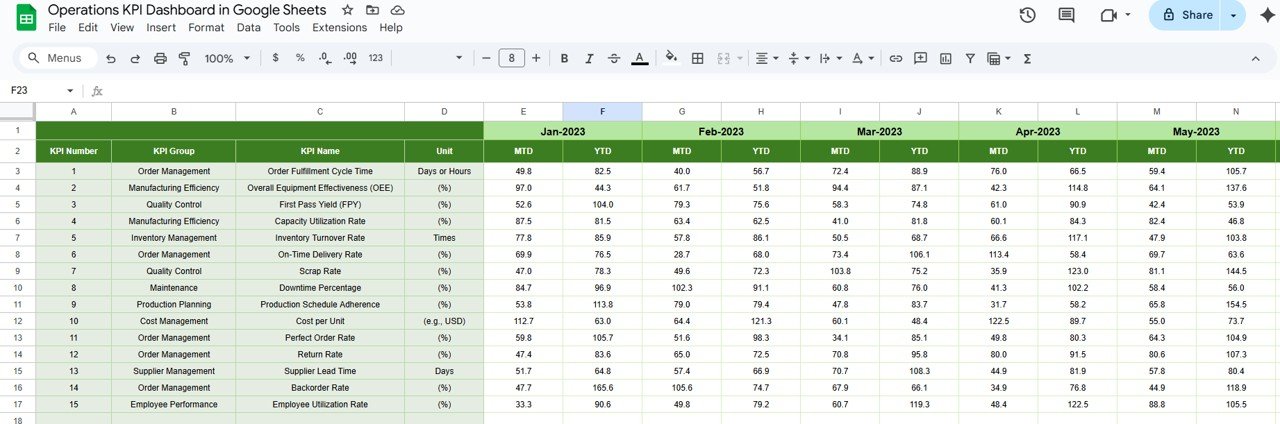
Dashboard Sheet Tab:
- This is the main sheet where all key metrics and KPIs are displayed.
- Range D3 allows users to select the month, and the data on the dashboard will update accordingly.
- The dashboard includes MTD (Month-to-Date) and YTD (Year-to-Date) actual figures, targets, and comparisons with previous year data.
- The Target vs. Actual and PY (Previous Year) vs. Actual comparisons are shown with conditional formatting, using arrows to indicate whether performance has increased or decreased.
Click to buy Operations KPI Dashboard in Google Sheets
KPI Trend Sheet Tab:
- In this tab, users can select specific KPIs from a drop-down list available in Cell C3.
- It displays the KPI Group, Unit, Type of KPI (whether “Lower is Better” or “Upper is Better”), the Formula to calculate the KPI, and its Definition.

Click to buy Operations KPI Dashboard in Google Sheets
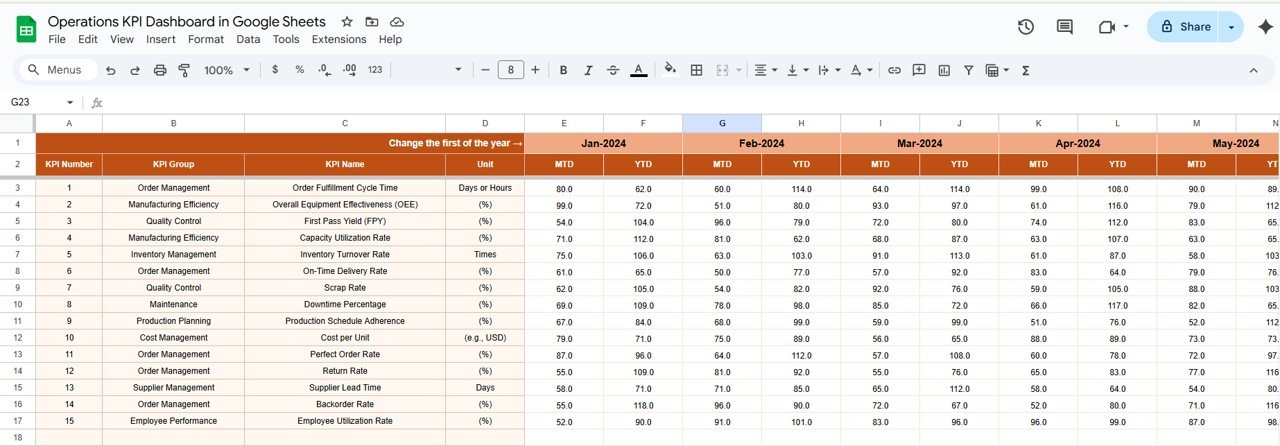
Actual Numbers Sheet Tab:
- This tab allows users to input actual data for MTD and YTD.
- The month can be changed using Range E1, and users simply need to enter the first month of the year for the calculations to update.
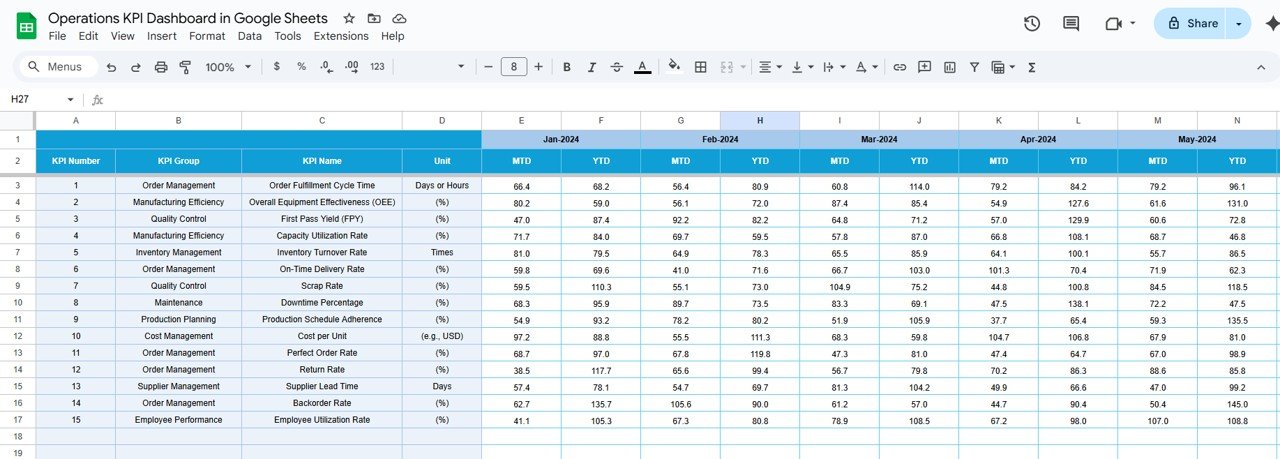
Target Sheet Tab:
Here, users input the target numbers for each KPI, both for MTD and YTD.
Click to buy Operations KPI Dashboard in Google Sheets
Previous Year Numbers Sheet Tab:
This sheet stores the previous year’s numbers for comparison purposes, allowing users to track performance over time.
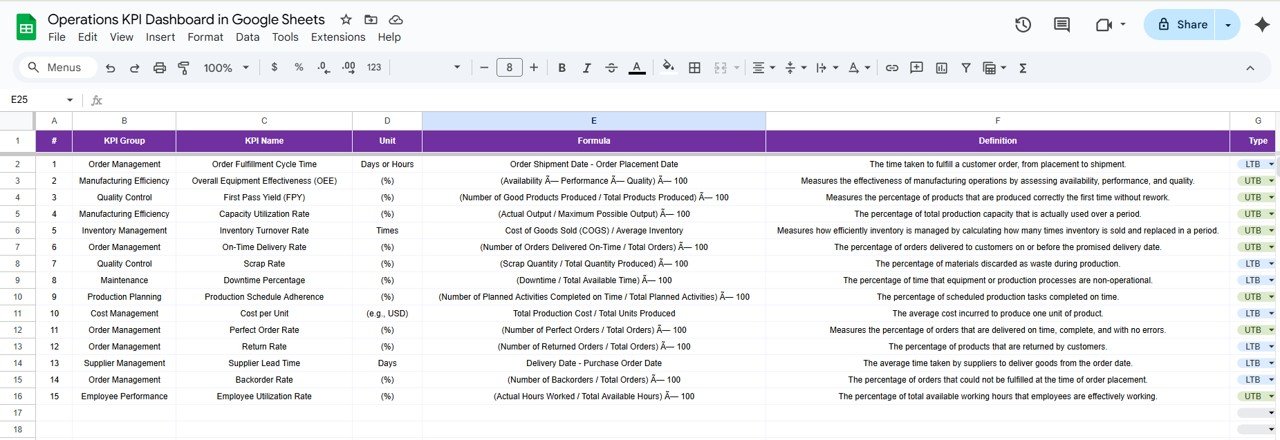
KPI Definition Sheet Tab:
Users can enter the names of KPIs, their groups, units of measurement, formulas, and definitions in this sheet for clarity and reference.
Click to buy Operations KPI Dashboard in Google Sheets
Advantages of Using an Operations KPI Dashboard
-
Real-Time Performance Monitoring: The dashboard provides real-time insights into operations, enabling managers to act quickly and make data-driven decisions.
-
Improved Decision-Making: By visualizing critical metrics, businesses can make more informed decisions that lead to better operational strategies and cost efficiencies.
-
Enhanced Operational Efficiency: Tracking KPIs such as Operational Efficiency, Cost Per Unit, and Inventory Turnover allows companies to identify inefficiencies and optimize processes.
-
Goal Alignment: The dashboard helps ensure that all operations are aligned with company goals, whether it’s increasing productivity or improving customer satisfaction.
-
Proactive Issue Resolution: The dashboard’s ability to display MTD, YTD, and PY comparisons helps identify trends and issues early, enabling proactive measures to be taken.
Opportunities for Improvement in Operations KPI Dashboard
- Integration with External Data Sources: One opportunity for improvement is to integrate the dashboard with other data sources such as ERP or CRM systems. This can provide even more accurate, real-time data and insights.
- Advanced Data Analysis: Incorporating predictive analytics or machine learning algorithms could enhance the ability of the dashboard to predict trends and highlight potential risks before they occur.
- Customization of KPIs: The KPIs listed in this dashboard are standard for most organizations, but it’s essential to customize the dashboard to meet the unique needs of your business. For example, if you’re in the retail sector, you might want to include KPIs specific to sales or customer experience.
- Mobile Access: To increase accessibility, the dashboard could be optimized for mobile devices, allowing managers to monitor operations on the go.
Best Practices for Managing Your Operations KPI Dashboard
-
Set Clear Objectives: Define the key objectives that each KPI will measure and ensure they align with your overall business strategy.
-
Regular Data Updates: Ensure the data in the dashboard is updated regularly, either manually or automatically, to provide accurate and timely information.
-
Monitor Trends, Not Just Numbers: While individual KPIs are important, it’s equally crucial to analyze trends over time to gain a deeper understanding of performance.
-
Provide Access to Key Stakeholders: Ensure that relevant team members and managers have access to the dashboard so that they can monitor performance and take action when necessary.
-
Train Team Members: Proper training is essential to ensure that everyone understands how to use the dashboard and interpret the KPIs effectively.
Conclusion
Click to buy Operations KPI Dashboard in Google Sheets
An Operations KPI Dashboard in Google Sheets is a powerful tool that can help businesses track and optimize their operations effectively. By monitoring key metrics such as Operational Efficiency, Production Downtime, and Customer Satisfaction, organizations can improve performance, make better decisions, and drive growth. By following best practices and continuously improving the dashboard, businesses can ensure that they stay ahead of the competition and achieve their operational goals.
Frequently Asked Questions with Answers
1. What is the purpose of an Operations KPI Dashboard? The purpose of an Operations KPI Dashboard is to provide a real-time, visual overview of key performance metrics, enabling businesses to monitor, analyze, and improve their operations.
2. How can I customize the Operations KPI Dashboard? You can customize the dashboard by adding or removing KPIs based on the specific needs of your business, such as incorporating additional operational data or industry-specific metrics.
3. Can the Operations KPI Dashboard be automated? Yes, you can automate data entry and updates by integrating the dashboard with other business tools like ERP or CRM systems, ensuring that the data is always up-to-date.
4. How do I calculate KPIs on the Operations Dashboard? KPIs are calculated using formulas based on the data you input into the dashboard. For example, the Cost Per Unit KPI is calculated by dividing the total production costs by the total units produced.
5. How often should I update my Operations KPI Dashboard? It’s recommended to update your Operations KPI Dashboard regularly—either weekly or monthly—depending on the frequency of data changes and the pace of your business.
Visit our YouTube channel to learn step-by-step video tutorials
Youtube.com/@NeotechNavigators
Click to buy Operations KPI Dashboard in Google Sheets