Order fulfillment plays a critical role in supply chain efficiency, customer satisfaction, and business growth. When orders are delayed, partially fulfilled, or processed inaccurately, it affects customer trust and increases operational costs. To avoid these issues, businesses must continuously measure order performance using well-defined KPIs.
The Order Fulfillment KPI Dashboard in Google Sheets provides a complete, ready-to-use solution to track fulfillment efficiency, accuracy, timeliness, and overall order health. It automatically compares MTD, YTD, Target, and Previous Year values and highlights performance changes using conditional formatting.
In this article, we will explain every part of the dashboard, worksheets, KPIs, and trend analysis — along with a complete KPI definition table.
What Is an Order Fulfillment KPI Dashboard in Google Sheets?
Click to Buy Order Fulfillment KPI Dashboard in Google Sheets
An Order Fulfillment KPI Dashboard is a Google Sheets-based performance-tracking system designed to measure the effectiveness, speed, and accuracy of order processing. It allows supply chain, operations, warehouse, and logistics teams to monitor monthly performance, identify bottlenecks, and improve customer satisfaction.
This dashboard shows:
✔ MTD Actual, Target, Previous Year
✔ YTD Actual, Target, Previous Year
✔ Conditional formatting arrows (↑↓)
✔ KPI Trend analysis
✔ KPI definitions with units, formulas, and KPI type (UTB/LTB)
It has 6 worksheets, each one serving a specific purpose.
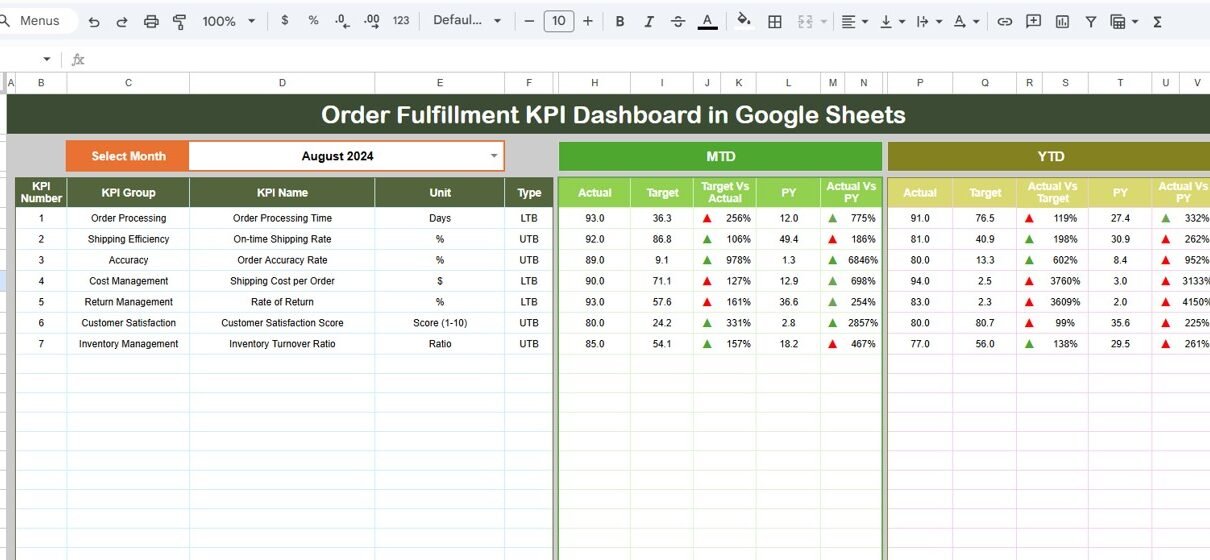
Dashboard Sheet Tab — Main KPI Summary
This is the central page of the dashboard.
Features:
- Month selector in cell D3
- MTD and YTD comparisons
- Target vs Actual deviations
- PY vs Actual comparisons
- Up and down arrows for performance approval
- Summary cards and KPI visuals
Every time you select a month, the dashboard updates instantly.

Click to Buy Order Fulfillment KPI Dashboard in Google Sheets
KPI Trend Sheet Tab
This sheet allows deeper analysis of any single KPI.
Features:
Dropdown in cell C3 to select KPI
Displays:
- KPI Group
- Unit
- KPI Type (UTB – Upper The Better, LTB – Lower The Better)
- Formula
- KPI Definition
Trend chart across 12 months
This helps identify patterns, seasonality, or recurring issues.

Click to Buy Order Fulfillment KPI Dashboard in Google Sheets
Actual Number Sheet Tab
Here you enter:
-
MTD Actual
-
YTD Actual
You can choose the first month of the financial year using cell E1.

Target Sheet Tab
Enter target values for each month (MTD & YTD).

Click to Buy Order Fulfillment KPI Dashboard in Google Sheets
Previous Year Number Sheet Tab
Enter last year’s MTD/YTD numbers to compare performance.

KPI Definition Sheet Tab
Enter KPI Name, Group, Unit, Formula, Definition, and Type.

Click to Buy Order Fulfillment KPI Dashboard in Google Sheets
Advantages of the Order Fulfillment KPI Dashboard
-
Real-time visibility into fulfillment performance
-
Helps minimize delays and improve customer experience
-
Identifies bottlenecks in warehouse, picking, or delivery
-
Tracks accuracy and quality issues
-
Improves inventory planning and forecasting
-
Helps reduce operational and fulfillment cost
-
Strengthens supplier & warehouse coordination
-
Fully cloud-based using Google Sheets
Opportunities for Improvement
Click to Buy Order Fulfillment KPI Dashboard in Google Sheets
You can enhance the dashboard with:
-
Fulfillment forecasts using moving averages
-
Delivery route efficiency analysis
-
Auto-email alerts for KPI drops
-
Google Forms integration for order input
-
Region, product, or customer segment filters
-
Color-coded SLA monitoring
Best Practices for Order Fulfillment Performance
-
Update actuals daily or weekly
-
Monitor delays and address recurring patterns
-
Review backorders weekly
-
Track warehouse accuracy metrics closely
-
Conduct monthly trend analysis
-
Use dashboards in team performance meetings
-
Compare current vs previous year performance regularly
Conclusion
Click to Buy Order Fulfillment KPI Dashboard in Google Sheets
The Order Fulfillment KPI Dashboard in Google Sheets provides complete visibility into your order processing and delivery performance. With detailed KPIs, trend charts, and monthly comparisons, businesses can improve fulfillment speed, accuracy, and customer satisfaction.
This dashboard is perfect for supply chain teams, warehouse operations, logistics managers, and eCommerce businesses looking to streamline their order fulfillment process.
Frequently Asked Questions (FAQ)
1. Can I add more KPIs to the dashboard?
Yes, the KPI Definition sheet allows unlimited KPIs.
2. Does it support multiple warehouses?
Yes — add warehouse fields and use filters.
3. Can the dashboard track order delays?
Yes — using Order Cycle Time and On-time Delivery Rate.
4. Does the dashboard auto-update?
Yes — all visuals refresh whenever you update data.
Visit our YouTube channel to learn step-by-step video tutorials
Youtube.com/@NeotechNavigators
Watch the step-by-step video Demo:
Click to Buy Order Fulfillment KPI Dashboard in Google Sheets