Successful partner onboarding is one of the most important stages in building strong, long-term partner relationships. When onboarding runs smoothly, partners become productive faster, understand your processes better, and start contributing to revenue earlier.Partner Onboarding KPI Dashboard in Google Sheets
The Partner Onboarding KPI Dashboard in Google Sheets is a ready-to-use dashboard designed to track onboarding performance across all key metrics. It provides a clear view of onboarding quality, speed, training success, and partner readiness so you can improve efficiency and partner satisfaction.Partner Onboarding KPI Dashboard in Google Sheets
In this article, you’ll learn how the dashboard works, understand the sheet structure, and get a complete list of KPIs with their units, formulas, definitions, and performance direction.Partner Onboarding KPI Dashboard in Google Sheets
What Is the Partner Onboarding KPI Dashboard?
Click to Buy Partner Onboarding KPI Dashboard in Google Sheets
The Partner Onboarding KPI Dashboard is a Google Sheets-based performance dashboard that tracks every part of the partner onboarding journey. It monitors:
-
Onboarding speed
-
Training completion
-
Documentation readiness
-
Partner activation
-
Compliance scores
-
First revenue timelines
This dashboard provides MTD & YTD performance, Target vs Actual, PY vs Actual, and trend analysis to help partner management teams measure onboarding quality clearly.
Why Use Google Sheets for Partner Onboarding?
Google Sheets offers big advantages:
-
Cloud-based and accessible anywhere
-
Real-time updates and multi-user collaboration
-
Easy to customize and expand
-
Builds instant visual dashboards
-
No special software needed
This makes it perfect for partner program teams, channel operations, and onboarding managers.
Dashboard Structure and Sheet Tabs
The dashboard comes with 6 worksheets, each serving a specific purpose.
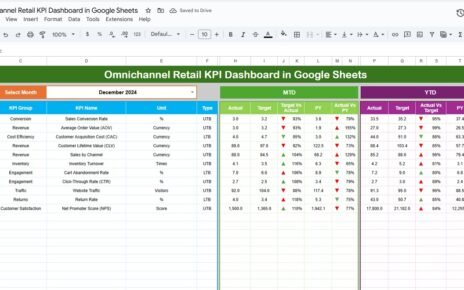
1. Dashboard Sheet Tab
This is the main dashboard.
-
Month selection available in Range D3
-
Dashboard auto-refreshes when month changes
Shows:
- MTD Actual, Target, Previous Year
- YTD Actual, Target, Previous Year
- Target vs Actual (with up/down arrows)
- PY vs Actual (with arrows)
This allows instant monitoring of onboarding performance.

Click to Buy Partner Onboarding KPI Dashboard in Google Sheets
2. KPI Trend Sheet Tab
This sheet provides the full details for each KPI.
When you select a KPI (Range C3), the sheet shows:
-
KPI Group
-
KPI Unit
-
KPI Type → Lower the Better / Upper the Better
-
KPI Formula
-
KPI Definition
-
Trend chart for historical analysis

3. Actual Number Sheet Tab
Enter the MTD and YTD actual values.
You can set the starting month of the year in Range E1.

Click to Buy Partner Onboarding KPI Dashboard in Google Sheets
4. Target Sheet Tab
Enter the monthly targets and YTD targets for each KPI.

5. Previous Year Sheet Tab
Enter the previous year’s data for MTD and YTD comparison.

Click to Buy Partner Onboarding KPI Dashboard in Google Sheets
6. KPI Definition Sheet Tab
This sheet contains:
-
KPI Name
-
KPI Group
-
Unit of Measurement
-
Formula
-
KPI Definition
-
Performance Type (Upper/Lower Better)

Advantages of Using This Dashboard
-
All onboarding KPIs in one place
-
MTD & YTD monitoring for fast insights
-
Better visibility into onboarding delays
-
Identify performance gaps in training
-
Improve partner satisfaction and readiness
-
Fully cloud-based and easy to update
-
Suitable for teams across multiple regions
Opportunities for Improvement
Click to Buy Partner Onboarding KPI Dashboard in Google Sheets
You can enhance the dashboard with:
-
Automated reminders for onboarding tasks
-
Integration with Google Forms for partner intake
-
Weighted scoring for partner readiness
-
Predictive analytics for onboarding delays
-
Individual partner scorecards
Best Practices for Using the Dashboard
-
Update actual numbers monthly
-
Track KPIs weekly during onboarding phases
-
Keep KPI definitions standard across teams
-
Share dashboard with partner managers
-
Use trends to identify repeated onboarding blockers
-
Ensure all onboarding tasks have clear owners
Conclusion
Click to Buy Partner Onboarding KPI Dashboard in Google Sheets
The Partner Onboarding KPI Dashboard in Google Sheets is a powerful tool to measure the speed, quality, and effectiveness of partner onboarding operations. With clear MTD/YTD metrics, target comparisons, and KPI trends, it helps organizations improve onboarding processes, shorten time-to-revenue, and ensure partners are fully prepared for success.
This dashboard supports data-driven decision-making and provides a complete picture of onboarding performance across all partners.
Frequently Asked Questions (FAQs)
Click to Buy Partner Onboarding KPI Dashboard in Google Sheets
1. What KPIs does this dashboard track?
It tracks onboarding time, training, readiness, satisfaction, compliance, and early partner performance.
2. Can the KPIs be customized?
Yes, all KPIs can be edited or expanded in the KPI Definition Sheet.
3. Is the dashboard auto-updating?
Yes, once the month changes in D3, all KPIs update automatically.
4. Can multiple users work on this dashboard?
Yes, Google Sheets supports real-time multi-user access.
5. Does this dashboard compare with targets and previous year?
Yes, it shows MTD & YTD comparison with both target and previous year.
Visit our YouTube channel to learn step-by-step video tutorials
Youtube.com/@NeotechNavigators
Watch the step-by-step video Demo:
Click to Buy Partner Onboarding KPI Dashboard in Google Sheets