Managing personal finances effectively requires tracking various key performance indicators (KPIs) to understand your spending habits, savings goals, and investment performance. The Personal Finance KPI Dashboard in Google Sheets is a powerful, user-friendly tool that allows you to monitor and analyze your financial health. This dashboard integrates real-time data and helps you stay on top of your financial goals by tracking multiple KPIs.
In this article, we will explore the features of this dashboard, the various KPIs it tracks, and how it can help you manage your personal finances efficiently.
What is a Personal Finance KPI Dashboard in Google Sheets?
A Personal Finance KPI Dashboard in Google Sheets is a financial tracking tool designed to help individuals monitor their income, expenses, savings, investments, and other key financial metrics. The dashboard is built using Google Sheets, which makes it easily accessible and customizable for anyone looking to track their finances.
This dashboard provides valuable insights into your financial habits, highlights areas for improvement, and helps you stay on course to achieve your financial goals.
Key Features of the Personal Finance KPI Dashboard in Google Sheets
Click to buy Personal Finance KPI Dashboard in Google Sheets
The Personal Finance KPI Dashboard in Google Sheets consists of 6 key worksheets, each playing an important role in tracking and analyzing your financial data.
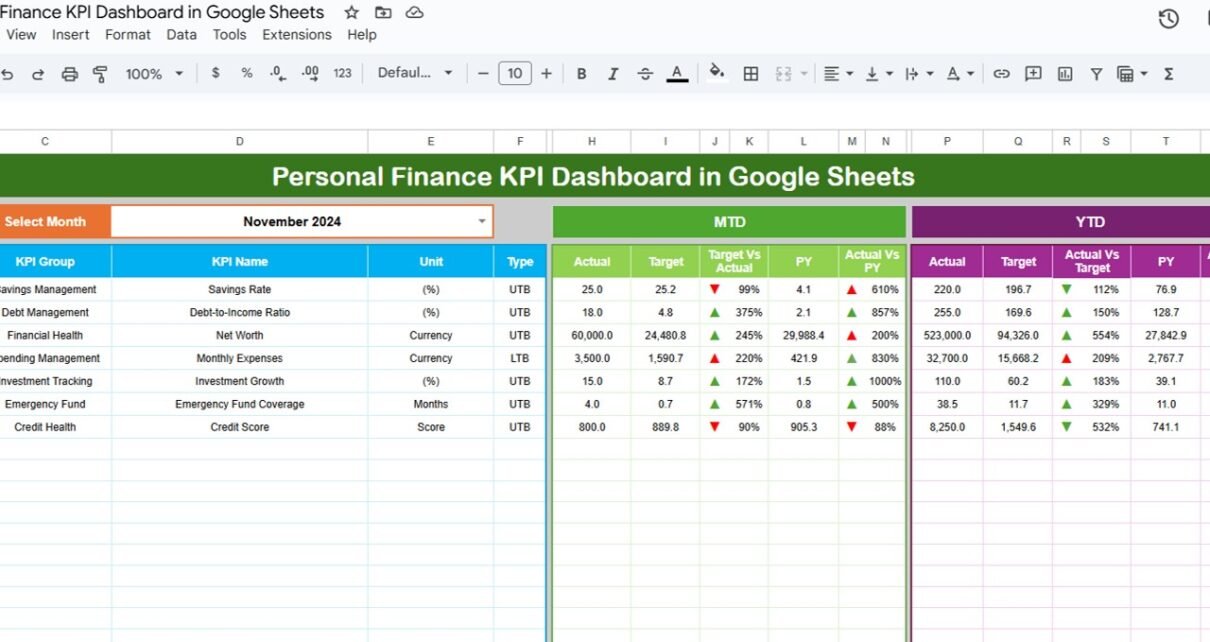
1) Dashboard Sheet Tab: The Main Overview
The Dashboard Sheet is the central hub of the KPI dashboard. It provides an overview of all KPIs, and you can select a specific month from a drop-down menu (located in range D3). The numbers for that month will automatically update across the entire dashboard.
Key features of the Dashboard Sheet include:
-
MTD Actual: Displays the actual value for Month-To-Date (MTD) for the selected month.
-
Target vs Actual: Compares the target value to the actual value for MTD with conditional formatting, using up and down arrows to indicate if the target is met.
-
YTD Actual: Shows the Year-To-Date (YTD) actual value for the selected month.
-
Target vs Actual for YTD: Similar to MTD, this compares the YTD target to the actual YTD value, with conditional formatting indicating performance.
-
PY vs Actual: This compares the performance of the current year (CY) to the previous year (PY) for both MTD and YTD data.

Click to buy Personal Finance KPI Dashboard in Google Sheets
2) KPI Trend Sheet Tab: Track KPI Progress Over Time
The KPI Trend Sheet provides a detailed look at the trends of individual KPIs. In this sheet, you can select a KPI name from a drop-down menu (range C3). The following information is displayed:
-
KPI Group: The category of the KPI (e.g., savings, income, expenses).
-
Unit: The unit of measurement for each KPI (e.g., dollars, percentage).
-
KPI Type: Whether the KPI is Lower the Better (LTB) or Upper the Better (UTB).
-
Formula: Displays the formula used to calculate the KPI.
-
Definition: A description of what the KPI represents and how it is measured.

3) Actual Number Sheet Tab: Enter Your Actual Financial Data
In the Actual Number Sheet, you input the actual financial numbers for both MTD and YTD for a particular month. The dashboard automatically updates based on the month entered in range E1 (simply input the first month of the year, and the data will adjust accordingly).

Click to buy Personal Finance KPI Dashboard in Google Sheets
4) Target Sheet Tab: Set Your Financial Targets
The Target Sheet is where you input your financial targets for each KPI, both for MTD and YTD. This sheet allows you to set specific goals for savings, income, expenses, and other key financial metrics.

5) Previous Year Number Sheet Tab: Historical Data Comparison
The Previous Year Number Sheet allows you to input data from the previous year to compare your financial performance with last year’s numbers. This historical comparison helps you track improvements or identify areas where you need to focus more.

Click to buy Personal Finance KPI Dashboard in Google Sheets
6) KPI Definition Sheet Tab: Defining Your KPIs
In the KPI Definition Sheet, you define each KPI by entering the following information:
-
KPI Name: The name of the financial KPI (e.g., savings rate, debt-to-income ratio).
-
KPI Group: The category the KPI falls under (e.g., savings, expenses).
-
Unit: The unit of measurement (e.g., dollars, percentage).
-
Formula: The calculation method for each KPI.
-
Definition: A clear description of what the KPI tracks and how it is calculated.

Benefits of Using the Personal Finance KPI Dashboard in Google Sheets
Using the Personal Finance KPI Dashboard in Google Sheets offers numerous benefits:
-
Clear Financial Overview: The dashboard provides a comprehensive view of your financial health, making it easy to see where you stand with respect to your goals.
-
Real-Time Data Tracking: With the ability to update data in real-time, you can track your progress continuously and make timely adjustments.
-
Goal Setting and Monitoring: By setting targets and comparing them against actual numbers, you can stay focused on achieving your financial goals.
-
Comparative Analysis: The historical data comparison with the previous year helps you track your progress and identify areas for improvement.
-
Customization: As a Google Sheets-based tool, the dashboard is fully customizable, allowing you to tailor it to your unique financial goals.
Best Practices for Using the Personal Finance KPI Dashboard
Click to buy Personal Finance KPI Dashboard in Google Sheets
To get the most out of your Personal Finance KPI Dashboard, here are some best practices to follow:
-
Update Your Data Regularly: Make sure to input actual numbers and update your targets regularly to ensure the dashboard remains relevant.
-
Use the Trend Feature to Identify Patterns: Regularly monitor your KPIs over time to spot trends and make necessary adjustments.
-
Set Realistic Targets: Set achievable targets for each KPI based on your current financial situation and future goals.
-
Review Your Progress Monthly: Take time at the end of each month to review your progress and adjust your financial strategies if necessary.
-
Leverage Historical Data: Compare your current performance with the previous year’s data to ensure you’re on track with your long-term financial goals.
Conclusion
The Personal Finance KPI Dashboard in Google Sheets is a powerful tool for anyone looking to take control of their finances. With its user-friendly interface, real-time tracking, and customizable features, it allows you to monitor your financial health and make data-driven decisions. Whether you want to track savings, expenses, or investment performance, this dashboard is a one-stop solution for managing your personal finances effectively.
Frequently Asked Questions (FAQs)
Click to buy Personal Finance KPI Dashboard in Google Sheets
1. What KPIs can I track using the Personal Finance KPI Dashboard?
You can track a wide range of KPIs, including savings rate, debt-to-income ratio, monthly expenses, investment returns, and more.
2. How often should I update the data in the dashboard?
It’s recommended to update your data monthly, so you can track your progress and make adjustments accordingly.
3. Can I customize the dashboard to include additional KPIs?
Yes, the dashboard is fully customizable, and you can add new KPIs or modify existing ones to fit your specific financial goals.
4. How do I use the historical data feature?
By inputting previous year data into the Previous Year Number Sheet, you can compare your current performance with past data to track improvements.
5. Is the Personal Finance KPI Dashboard suitable for beginners?
Yes, the dashboard is designed to be user-friendly, making it suitable for both beginners and advanced users. It helps you understand and manage your finances with ease.
Visit our YouTube channel to learn step-by-step video tutorials
Youtube.com/@NeotechNavigators
Watch the step-by-step video Demo:
Click to buy Personal Finance KPI Dashboard in Google Sheets