Managing a pet care business efficiently requires monitoring key performance indicators (KPIs) such as appointments, health checkups, grooming, and customer satisfaction. The Pet Care KPI Dashboard in Google Sheets is a ready-to-use solution to track, analyze, and optimize these KPIs.
In this article, we will explore the features, advantages, best practices, and FAQs of using this dashboard.
What Is a Pet Care KPI Dashboard?
A Pet Care KPI Dashboard is a visual and interactive tool built in Google Sheets to consolidate all KPIs related to pet care operations. It allows pet clinic managers, veterinarians, and grooming centers to monitor performance, track progress against targets, and make data-driven decisions.
With this dashboard, you can:
-
Track monthly (MTD) and yearly (YTD) performance
-
Compare actual results with targets and previous year’s performance
-
Identify trends in pet care services, customer feedback, and revenue
-
Make informed operational and strategic decisions
Key Features of the Pet Care KPI Dashboard
Click to Buy Pet Care KPI Dashboard in Google Sheets
This dashboard contains six worksheets, each designed to provide specific insights:
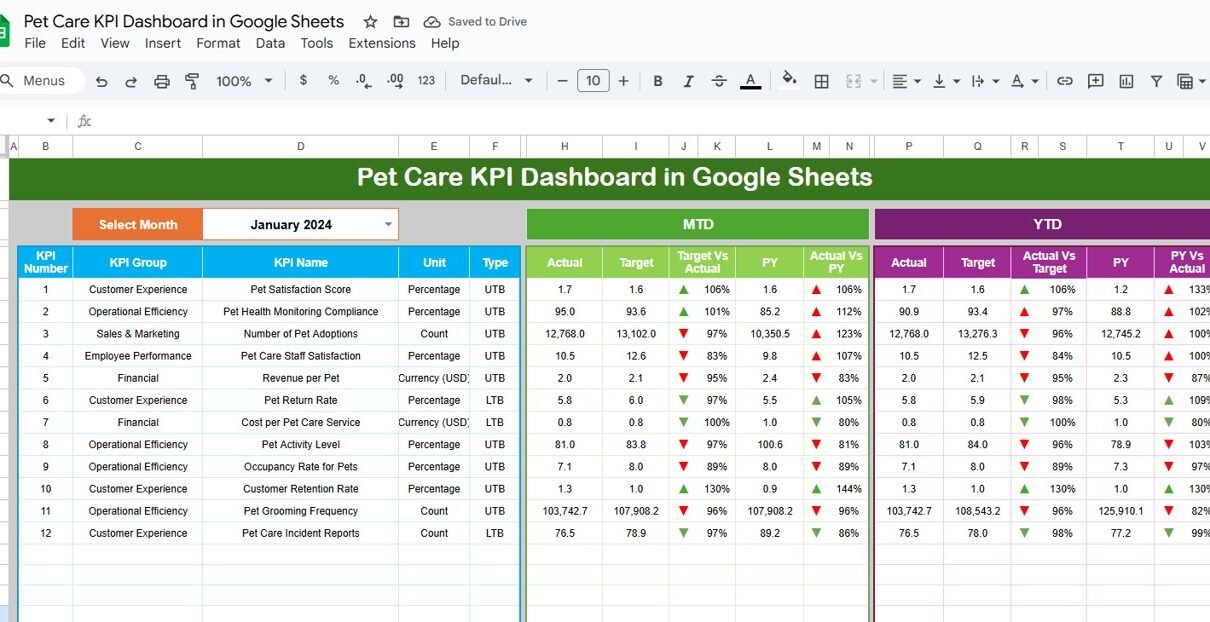
1. Dashboard Sheet Tab
The Dashboard Sheet provides a high-level overview of all KPIs:
-
Month Selection Dropdown (Range D3): Automatically updates all numbers for the selected month
-
MTD Metrics: Actual, Target, and Previous Year values with conditional formatting arrows
-
YTD Metrics: Aggregate performance data for the year with visual indicators
-
Target vs Actual and PY vs Actual: Quickly evaluate whether KPIs are meeting goals

Click to Buy Pet Care KPI Dashboard in Google Sheets
2. KPI Trend Sheet Tab
The KPI Trend Sheet provides detailed analysis of individual KPIs:
-
Select a KPI from the dropdown in Range C3
-
Displays KPI Group, Unit, Type (Lower-the-Better or Upper-the-Better)
-
Includes Formula and Definition of each KPI
-
Trend charts show performance over time for better decision-making
This sheet helps identify underperforming areas and opportunities for improvement.

Click to Buy Pet Care KPI Dashboard in Google Sheets
3. Actual Numbers Sheet Tab
-
Enter actual values for MTD and YTD for each KPI
-
Update the first month of the year in Range E1 to dynamically adjust calculations
-
Ensures dashboard reflects real-time performance metrics

4. Target Sheet Tab
-
Enter the target numbers for each KPI for the corresponding month
-
Track both MTD and YTD targets
-
Helps measure success and align with business objectives

Click to Buy Pet Care KPI Dashboard in Google Sheets
5. Previous Year Numbers Sheet Tab
-
Enter last year’s KPI data for comparison
-
Supports year-over-year analysis
-
Identifies trends and seasonal performance changes

Click to Buy Pet Care KPI Dashboard in Google Sheets
6. KPI Definition Sheet Tab
-
Record KPI Name, Group, Unit, Formula, Definition, and Type (Upper-the-Better or Lower-the-Better)Ensures clarity and consistency in measurement across the dashboard

Click to Buy Pet Care KPI Dashboard in Google Sheets
Advantages of Using the Pet Care KPI Dashboard
-
Centralized Data: All KPIs are tracked in one Google Sheet
-
Real-Time Insights: Data updates automatically for current month and year
-
Visual Analysis: Cards and trend charts make performance easy to interpret
-
Identify Areas for Improvement: Quickly spot underperforming metrics
-
Customizable: Add or adjust KPIs based on your pet care services
-
Decision Support: Helps prioritize services, staff allocation, and customer satisfaction
Best Practices for Using the Dashboard
-
Update Data Regularly: Enter actual numbers as services are completed
-
Segment KPIs: Track by service type, location, or pet category for detailed insights
-
Monitor Trends: Use KPI Trend Sheet to evaluate monthly and yearly performance
-
Focus on High-Impact KPIs: Prioritize metrics like customer satisfaction and service completion
-
Communicate Insights: Share dashboard results with staff to improve service quality
-
Use Conditional Formatting: Quickly identify KPIs that are underperforming or exceeding targets
How This Dashboard Helps Pet Care Businesses
Click to Buy Pet Care KPI Dashboard in Google Sheets
-
Optimize Operations: Allocate staff and resources based on KPI performance
-
Increase Customer Satisfaction: Identify and address areas where clients are dissatisfied
-
Track Service Efficiency: Measure time and performance for grooming, appointments, and treatments
-
Monitor Growth: Compare MTD and YTD performance to plan for expansion
-
Data-Driven Decisions: Make strategic decisions based on real-time insights
Frequently Asked Questions (FAQs)
Q1: Can I add more KPIs to this dashboard?
Yes, you can customize the dashboard by adding additional KPIs in the KPI Definition Sheet.
Q2: How often should I update the data?
Update data whenever new appointments or services are completed; monthly updates are ideal for trend analysis.
Q3: Can I track performance by location or service type?
Yes, you can segment KPIs by location, service type, or pet category for detailed insights.
Q4: Does the dashboard show trends over time?
Yes, the KPI Trend Sheet allows tracking of MTD and YTD metrics and year-over-year comparisons.
Q5: Is this dashboard suitable for multiple pet care centers?
Yes, you can duplicate sheets or create separate dashboards for multiple locations.
Conclusion
The Pet Care KPI Dashboard in Google Sheets is a comprehensive, visual, and ready-to-use tool to monitor performance metrics, customer satisfaction, and operational efficiency. By tracking appointments, services, and KPIs, pet care businesses can optimize their operations, improve service quality, and make data-driven decisions to drive growth.
Visit our YouTube channel to learn step-by-step video tutorials
Youtube.com/@NeotechNavigators