The petroleum industry relies heavily on efficient operations, safety management, and profitability metrics. To ensure that business goals are met, it’s essential to track key performance indicators (KPIs). The Petroleum Industry KPI Dashboard in Google Sheets is a powerful tool designed to help industry professionals track and measure vital performance metrics in real-time. This dashboard provides a comprehensive overview of various KPIs related to production, safety, operations, and financial performance.
In this article, we will walk you through the key features of the Petroleum Industry KPI Dashboard, explain the KPIs tracked, and show how it can help optimize operations and decision-making in the petroleum sector.
What is a Petroleum Industry KPI Dashboard?
A Petroleum Industry KPI Dashboard is a tool that aggregates and visualizes key performance metrics essential for managing the various aspects of petroleum operations. It allows stakeholders to monitor critical data such as production levels, safety incidents, financial performance, and operational efficiency. By consolidating all of these KPIs into a single dashboard, decision-makers can quickly assess performance and take the necessary actions to improve outcomes.
The Google Sheets template is designed for flexibility and ease of use, offering a customizable, real-time view of performance indicators that matter most to petroleum industry professionals.
Key Features of the Petroleum Industry KPI Dashboard in Google Sheets
The Petroleum Industry KPI Dashboard includes several key worksheets that track important metrics related to operations, safety, financial performance, and more. Here’s a breakdown of the dashboard’s core features:
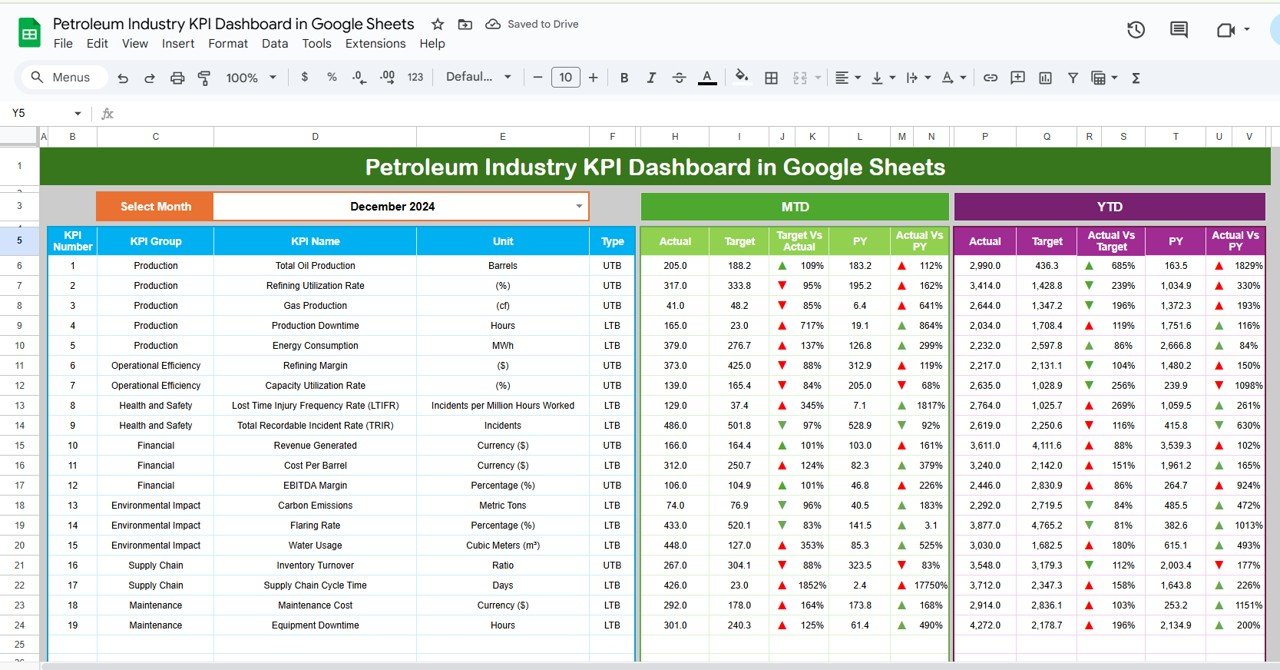
1. Dashboard Sheet Tab
The Dashboard Sheet serves as the central hub for all your KPIs. This sheet displays key metrics and data in a visual format.
Month Dropdown (D3): Select a specific month from the dropdown, and the dashboard will automatically update with the relevant data for that month.
Key Metrics:
- MTD Actual, Target, Previous Year Data: Displays actual performance for the current month, compared with the target and previous year’s data.
- YTD Actual, Target, Previous Year Data: Tracks year-to-date performance and compares it with targets and last year’s data.
Conditional Formatting: Up and down arrows are used to visually show whether the actual performance meets the target for both MTD and YTD data.
Click to buy Petroleum Industry KPI Dashboard in Google Sheets
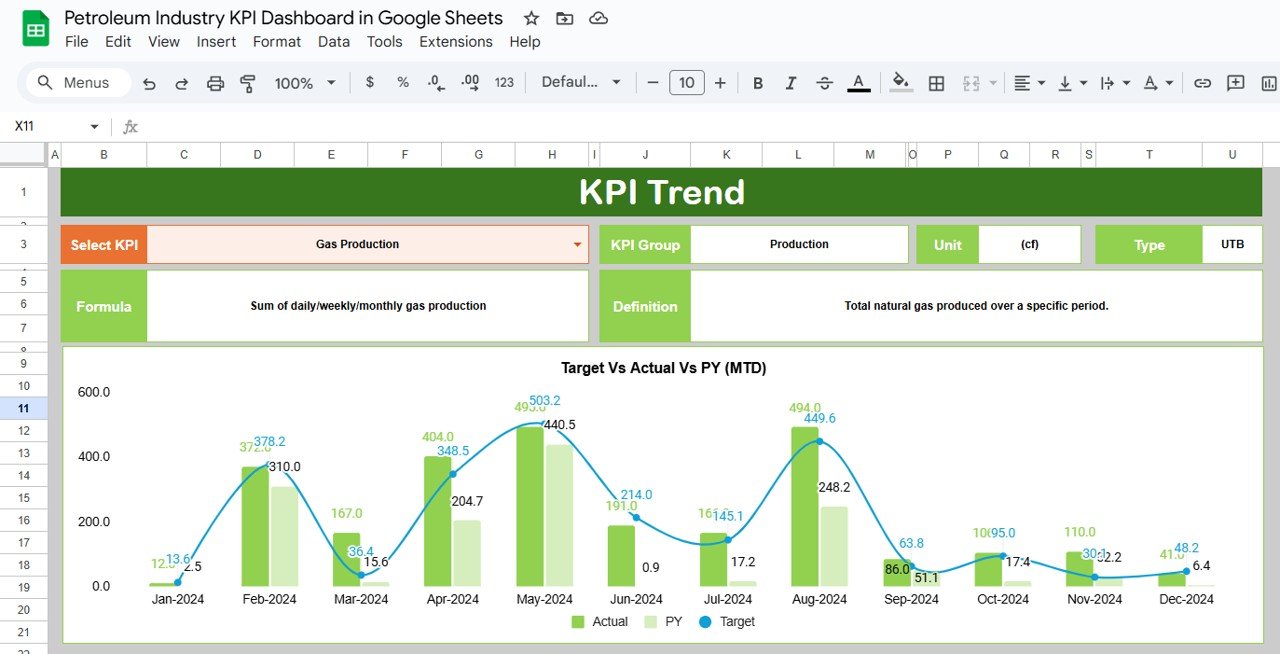
2. KPI Trend Sheet Tab
The KPI Trend Sheet is used to analyze trends in performance over time.
-
KPI Selection Dropdown (C3): Select a specific KPI to see how it’s performed over the last few months.
-
KPI Group, Unit, Type: Displays the KPI’s group (e.g., production, safety), unit of measurement, and whether the KPI is “Lower the Better” (LTB) or “Upper the Better” (UTB).
-
Formula and Definition: Shows the formula used to calculate the KPI and provides a detailed explanation of what it measures.
Click to buy Petroleum Industry KPI Dashboard in Google Sheets
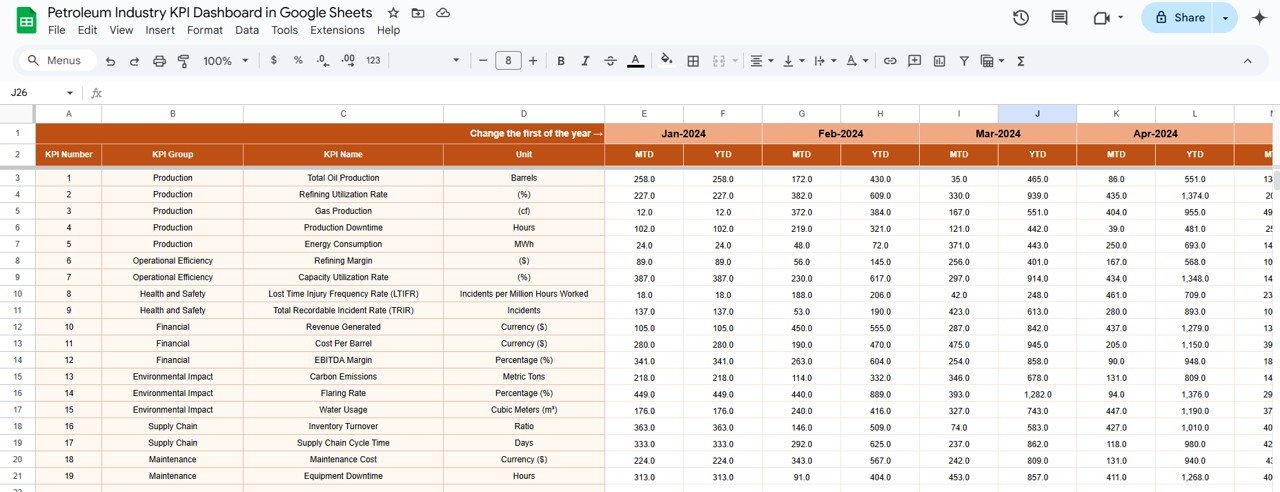
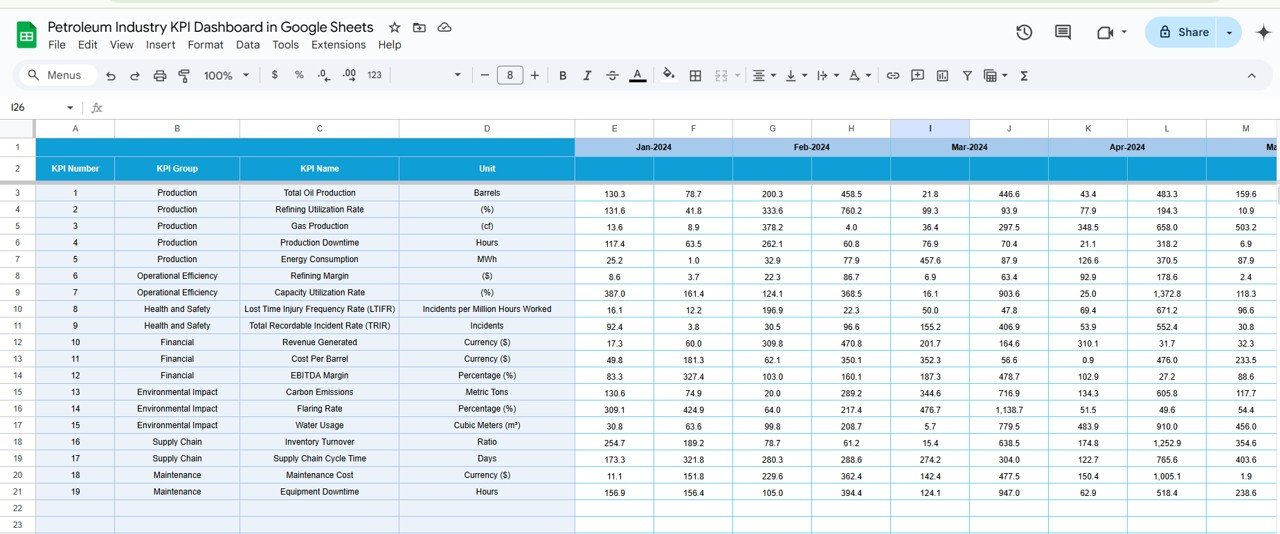
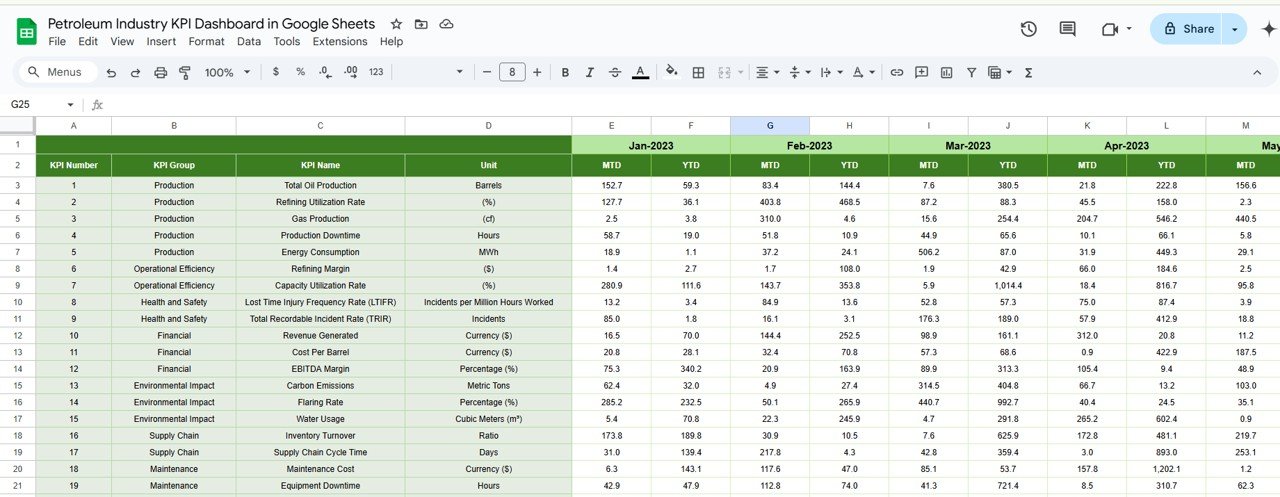
3. Actual Numbers Sheet Tab
In this tab, you can enter actual performance data for the month:
-
MTD and YTD Input: Enter actual numbers for the key KPIs on a month-to-date (MTD) and year-to-date (YTD) basis.
-
Month Selection (E1): Select the first month of the year, and the data will update automatically based on the selection.
Click to buy Petroleum Industry KPI Dashboard in Google Sheets
4. Target Sheet Tab
The Target Sheet allows you to input the target values for each KPI:
-
Monthly and YTD Targets: Enter the target values for each KPI for both MTD and YTD performance. These targets will be compared against actual data to track progress.
Click to buy Petroleum Industry KPI Dashboard in Google Sheets
5. Previous Year Number Sheet Tab
This sheet allows you to input data from the previous year:
-
Historical Comparison: Enter the previous year’s data to compare performance and identify any changes or trends over time.
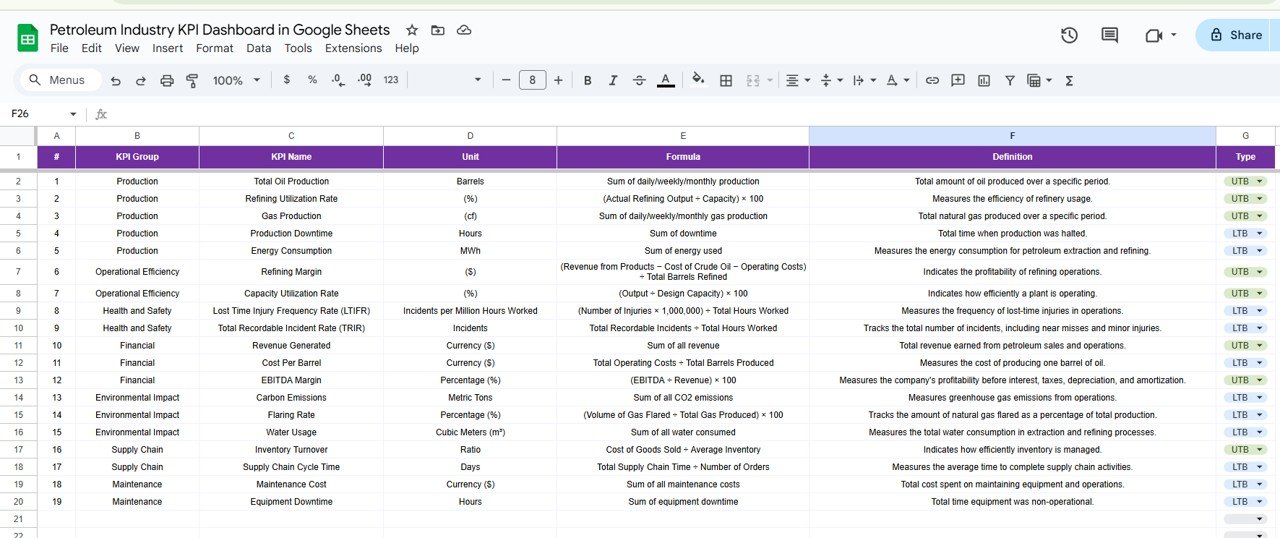
6. KPI Definition Sheet Tab
The KPI Definition Sheet helps you define each KPI clearly:
-
KPI Name, Group, Unit: Define the KPI’s name, group (e.g., safety, financial), and unit of measurement.
-
Formula and Definition: Provide the formula used to calculate the KPI and a detailed definition, offering clarity on how each metric contributes to overall performance.
Click to buy Petroleum Industry KPI Dashboard in Google Sheets
Advantages of Using the Petroleum Industry KPI Dashboard
The Petroleum Industry KPI Dashboard provides several benefits:
-
Centralized Data: All relevant KPIs are consolidated in one easy-to-use dashboard, offering a comprehensive view of business performance.
-
Real-Time Tracking: Track KPIs in real time, helping you make informed decisions and respond quickly to changes in performance.
-
Visual Representation: The dashboard includes charts and visual indicators like up and down arrows, making it easier to interpret data at a glance.
-
Improved Decision-Making: By visualizing important KPIs, the dashboard helps decision-makers make data-driven choices to improve efficiency, profitability, and safety.
-
Customization: The dashboard can be tailored to your specific needs, adding new KPIs or modifying the layout to fit your business objectives.
Opportunity for Improvement in the Petroleum Industry KPI Dashboard
Click to buy Petroleum Industry KPI Dashboard in Google Sheets
While the Petroleum Industry KPI Dashboard is highly effective, there are opportunities for enhancement:
-
Integration with Industry Platforms: Integrating the dashboard with industry-specific platforms like SCADA or ERP systems can automate data collection and minimize errors.
-
Predictive Analytics: Adding predictive features could help forecast trends in production, safety, and revenue, enabling proactive adjustments.
-
Mobile Accessibility: Creating a mobile version of the dashboard would allow stakeholders to track KPIs while on the go, improving accessibility and responsiveness.
-
Advanced Reporting: Enhancing the reporting functionality to generate automated monthly or quarterly reports would save time and improve efficiency.
Best Practices for Using the Petroleum Industry KPI Dashboard
To maximize the benefits of the Petroleum Industry KPI Dashboard, follow these best practices:
- Update Data Regularly: Ensure that data is regularly updated for accurate tracking and decision-making.
- Focus on High-Impact KPIs: Track the KPIs that directly affect your operational efficiency, safety, and profitability.
- Monitor Trends Over Time: Use trend analysis to spot patterns and identify areas for improvement in operations and safety.
- Set Realistic Targets: Set achievable performance targets based on historical performance and industry benchmarks.
- Collaborate Across Teams: Share the dashboard with key team members to ensure alignment on goals and performance expectations.
Conclusion
Click to buy Petroleum Industry KPI Dashboard in Google Sheets
The Petroleum Industry KPI Dashboard in Google Sheets is an invaluable tool for tracking key metrics in the petroleum sector. Whether you’re monitoring production volume, safety performance, operational efficiency, or financial results, this dashboard helps you keep track of performance, make informed decisions, and optimize operations. By using real-time data and visualizing critical KPIs, the dashboard enables better decision-making, fostering growth and efficiency in your petroleum business.
Frequently Asked Questions (FAQs)
1. What KPIs are tracked in the Petroleum Industry KPI Dashboard?
The dashboard tracks KPIs such as total production volume, safety incident rate, refining capacity utilization, total revenue, and more.
2. How do I input data into the Petroleum Industry KPI Dashboard?
Data is entered through the Actual Numbers Sheet, where you input monthly and year-to-date data. The Target Sheet allows you to set your target numbers.
3. Can I customize the Petroleum Industry KPI Dashboard?
Yes, the dashboard is fully customizable. You can add new KPIs, modify formulas, and adjust the layout to suit your needs.
4. How often should I update the data in the Petroleum Industry KPI Dashboard?
It’s recommended to update the dashboard regularly (e.g., weekly or monthly) to keep the data accurate and reflective of current performance.
5. Can I integrate the Petroleum Industry KPI Dashboard with other platforms?
Yes, the dashboard can be integrated with other data platforms or systems for automated data entry, improving accuracy and reducing manual input.
Visit our YouTube channel to learn step-by-step video tutorials
Youtube.com/@NeotechNavigators
Watch the step-by-step video Demo:
Click to buy Petroleum Industry KPI Dashboard in Google Sheets