The pharmaceutical industry deals with vast amounts of data that require careful management and analysis to ensure optimal operations. The Pharmaceutical Dashboard in Google Sheets is a ready-to-use tool designed to help you track key metrics such as total revenue, profit, units sold, and much more. By utilizing this dashboard, pharmaceutical companies can easily monitor performance, identify trends, and make informed decisions to optimize their operations.
In this article, we will walk you through the features of the Pharmaceutical Dashboard in Google Sheets, explaining how it helps streamline pharmaceutical data management and decision-making.
What is the Pharmaceutical Dashboard in Google Sheets?
The Pharmaceutical Dashboard in Google Sheets is a comprehensive tool designed to track important metrics related to pharmaceutical sales and inventory. It allows businesses to monitor key performance indicators (KPIs) like revenue, profit, units sold, and product stock status in real time. The dashboard offers visual charts and detailed insights that enable businesses to analyze trends, optimize inventory management, and evaluate sales performance.
The dashboard consists of three key worksheets: the Dashboard Sheet, the Search Sheet, and the Data Sheet.
Key Features of the Pharmaceutical Dashboard
Click to buy Pharmaceutical Dashboard in Google Sheets
1) Dashboard Sheet Tab: The Central Reporting Interface
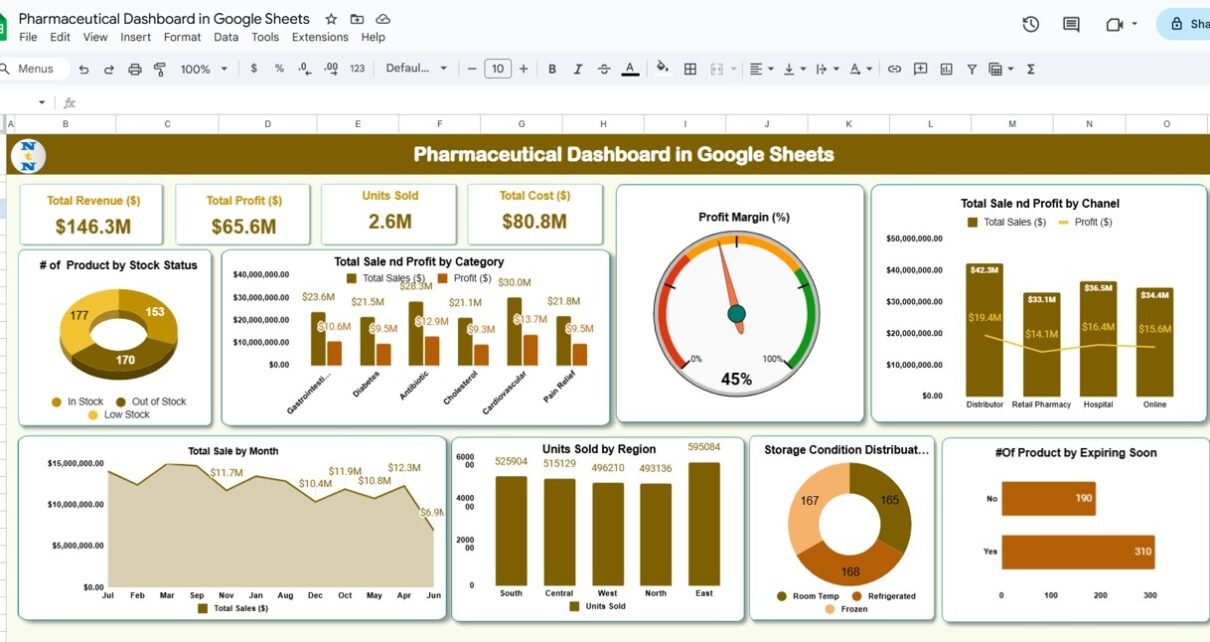
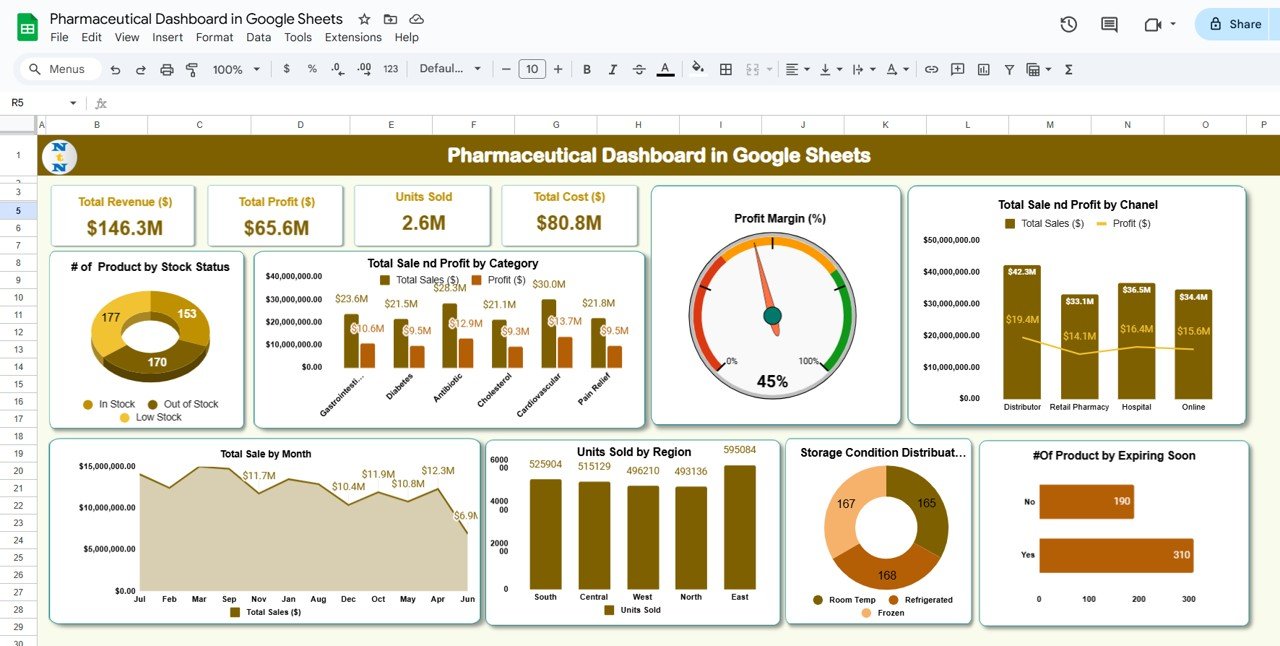
The Dashboard Sheet is where all the key metrics are presented in a visually appealing and easy-to-understand format. The sheet includes the following elements:
Cards:
- Total Revenue ($): Displays the total revenue generated from pharmaceutical sales.
- Total Profit ($): Shows the total profit earned from sales after deducting costs.
- Units Sold: Tracks the total number of units sold during the selected period.
- Total Cost ($): Displays the total cost incurred for the pharmaceutical products sold.
- Profit Margin (%): Calculates the profit margin by dividing profit by revenue, giving insights into profitability.
These cards provide a quick snapshot of the pharmaceutical company’s financial performance, helping stakeholders make data-driven decisions.
Charts:
- # of Products by Stock Status: Displays the number of products categorized by their stock status (e.g., in stock, out of stock).
- Total Sales and Profit by Category: Breaks down the total sales and profit by product category (e.g., antibiotics, pain relief).
- Profit Margin (%): A chart visualizing the profit margin percentage for various products or categories.
- Total Sales and Profit by Channel: Displays sales and profit data by sales channel (e.g., retail pharmacy, distributor, online).
- Total Sales by Month: Visualizes total sales data over a period of time, by month.
- Units Sold by Region: Tracks the number of units sold by different regions (e.g., North, South, East, West).
- Storage Condition Distribution: Shows the distribution of products based on their storage conditions (e.g., refrigerated, frozen, room temperature).
- # of Products by Expiring Soon: Displays the number of products that are nearing their expiration date.
These charts provide in-depth analysis, allowing stakeholders to gain insights into the performance of products, sales channels, and inventory conditions.
Click to buy Pharmaceutical Dashboard in Google Sheets
2) Search Sheet Tab: Easy Data Lookup
The Search Sheet allows you to quickly find and filter data based on specific search criteria. The key features include:
-
Search by Search Keyword and Field Name: Allows you to search by specific fields (e.g., Stock Status, Product Name, Category, etc.).
-
Total Record Count: Displays the total number of records available based on your search filter (e.g., the number of out-of-stock products).
-
Column Selection: Lets you select which column you want to search through, such as stock status, sales date, or product category.
This sheet is helpful for quick data lookup and efficient filtering of the dataset.
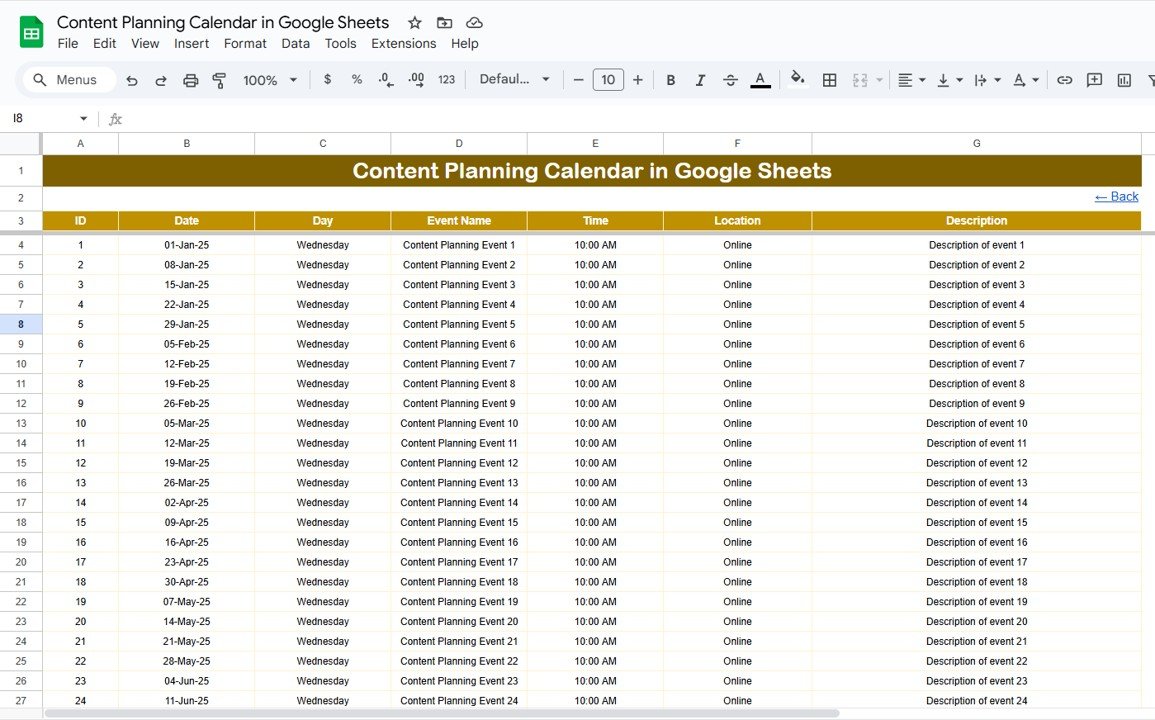
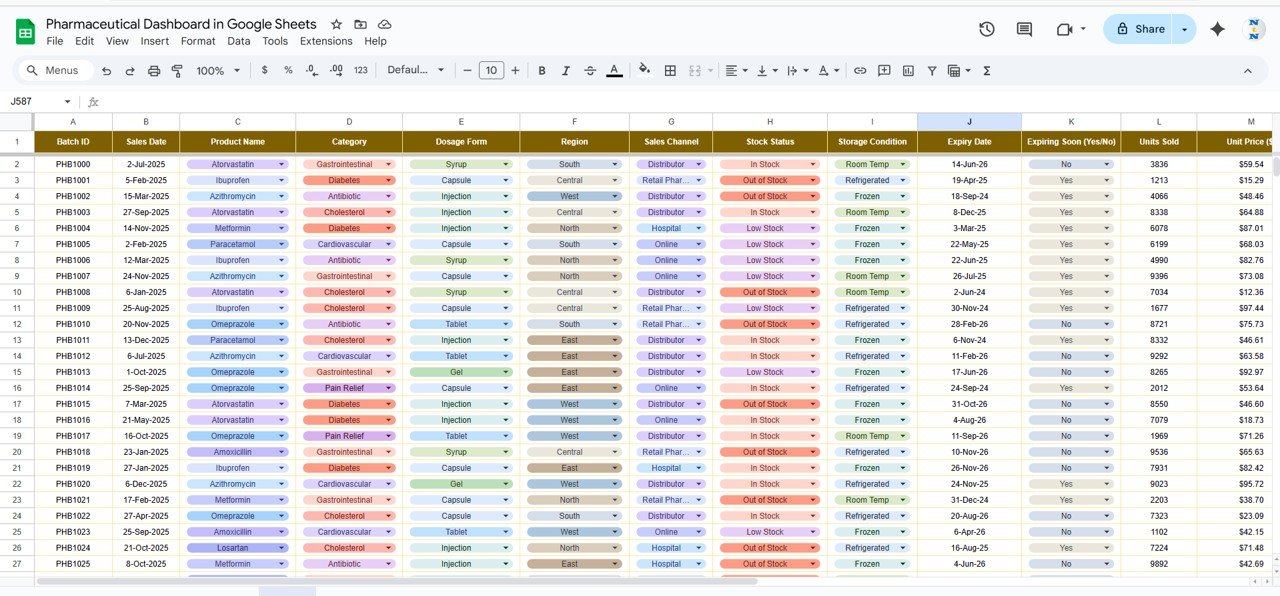
3) Data Sheet Tab: Input and Manage Raw Data
The Data Sheet is where all raw data related to pharmaceutical sales and inventory is entered. Key columns include:
- Batch ID: A unique identifier for each batch of products.
- Sales Date: The date when the sale was made.
- Product Name: The name of the product being sold (e.g., Ibuprofen, Azithromycin).
- Category: The category of the product (e.g., antibiotics, pain relief).
- Dosage Form: The form in which the product is available (e.g., tablet, injection, syrup).
- Region: The region where the product was sold (e.g., North, South).
- Sales Channel: The channel through which the product was sold (e.g., retail pharmacy, distributor, online).
- Stock Status: The current stock status of the product (e.g., in stock, out of stock).
- Storage Condition: The storage requirement for the product (e.g., refrigerated, frozen).
- Expiry Date: The expiration date of the product.
- Expiring Soon (Yes/No): Indicates whether the product is nearing its expiration date.
- Units Sold: The number of units sold.
- Unit Price ($): The price per unit of the product.
- Production Cost ($): The cost of producing the product.
- Total Sales ($): The total sales revenue for the product.
- Total Cost ($): The total cost incurred for the product.
- Profit ($): The profit generated from the sale (calculated as Total Sales – Total Cost).
- Month: The month in which the sale occurred.
This sheet is the foundation for all data analysis, where you can enter and maintain detailed records of pharmaceutical products and sales.
Click to buy Pharmaceutical Dashboard in Google Sheets
Benefits of Using the Pharmaceutical Dashboard
The Pharmaceutical Dashboard offers several advantages for pharmaceutical businesses:
-
Comprehensive Data Tracking: It consolidates key metrics like sales, profit, stock status, and units sold into a single dashboard, making it easier to track overall performance.
-
Data-Driven Decision Making: The visual charts help businesses analyze trends, track product performance, and identify areas that need improvement.
-
Easy Data Access: The Search Sheet makes it easy to find and filter data based on specific criteria, allowing for quick decision-making.
-
Improved Inventory Management: By tracking stock status, storage conditions, and products expiring soon, the dashboard helps optimize inventory management and prevent shortages.
-
Customizable: The dashboard is fully customizable, allowing businesses to add new columns, charts, or data points based on their specific needs.
Best Practices for Using the Pharmaceutical Dashboard
Click to buy Pharmaceutical Dashboard in Google Sheets
To maximize the effectiveness of the Pharmaceutical Dashboard, follow these best practices:
-
Update Data Regularly: Ensure that the Data Sheet is updated with the latest sales and inventory data to keep the dashboard accurate and up-to-date.
-
Monitor Key Metrics: Regularly review the cards and charts to monitor critical KPIs like total revenue, profit, and units sold.
-
Focus on Expiring Products: Use the # of Products by Expiring Soon chart to monitor products nearing expiration and take action to reduce waste.
-
Track Sales by Channel and Region: Review Total Sales and Profit by Channel and Units Sold by Region to identify successful sales channels and regions that need more attention.
-
Collaborate with Your Team: Share the dashboard with relevant team members to ensure everyone has access to the latest data and can make informed decisions.
Conclusion
The Pharmaceutical Dashboard in Google Sheets is an invaluable tool for any pharmaceutical business looking to track sales, monitor inventory, and optimize operations. By providing real-time insights, detailed charts, and easy data entry, this dashboard helps you stay on top of key metrics and make data-driven decisions to improve performance. Whether you’re managing product sales, analyzing profit margins, or monitoring inventory levels, this dashboard provides the structure and functionality you need to succeed.
Frequently Asked Questions (FAQs)
Click to buy Pharmaceutical Dashboard in Google Sheets
1. How often should I update the Pharmaceutical Dashboard?
It’s recommended to update the Data Sheet regularly, ideally after each sale or batch update, to ensure the dashboard reflects the latest data.
2. Can I customize the dashboard to track other metrics?
Yes, the dashboard is fully customizable. You can add additional columns, charts, or KPIs based on your specific needs.
3. Can I track multiple products and categories at once?
Yes, the Data Sheet allows you to track data for multiple products, categories, and sales channels, making it easy to manage a wide range of products.
4. How can I use the dashboard for inventory management?
The dashboard helps track stock status, storage conditions, and products expiring soon, allowing you to manage inventory more effectively and reduce waste.
5. Can I share the dashboard with my team?
Yes, since the dashboard is built in Google Sheets, you can easily share it with your team for real-time collaboration.
Visit our YouTube channel to learn step-by-step video tutorials
Youtube.com/@NeotechNavigators