In the competitive world of photography, running a successful business isn’t just about capturing perfect moments. It’s also about tracking performance, measuring results, and making data-driven decisions. That’s where the Photography Business KPI Dashboard in Google Sheets becomes a game-changer.Photography Business KPI Dashboard in Google Sheets
Whether you’re a freelance photographer, studio owner, or creative agency, this ready-to-use dashboard helps you monitor the health of your business using Key Performance Indicators (KPIs). In this post, we’ll walk you through every detail of this dashboard—from features and advantages to best practices and frequently asked questions.Photography Business KPI Dashboard in Google Sheets
What Is a Photography Business KPI Dashboard in Google Sheets?
A Photography Business KPI Dashboard in Google Sheets is a spreadsheet-based tool that allows photography professionals to track essential business metrics. These KPIs help you understand how your business is performing over time in areas like bookings, revenue, client satisfaction, marketing effectiveness, and resource utilization.
This dashboard includes visualizations, conditional formatting, trend tracking, and easy month-to-month performance comparisons. It’s perfect for anyone looking to grow their business and stay on top of their goals—without spending money on expensive software.
Inside the Photography KPI Dashboard: Sheet-by-Sheet Overview
This smartly organized tool comes with six interconnected worksheet tabs, each serving a specific purpose:
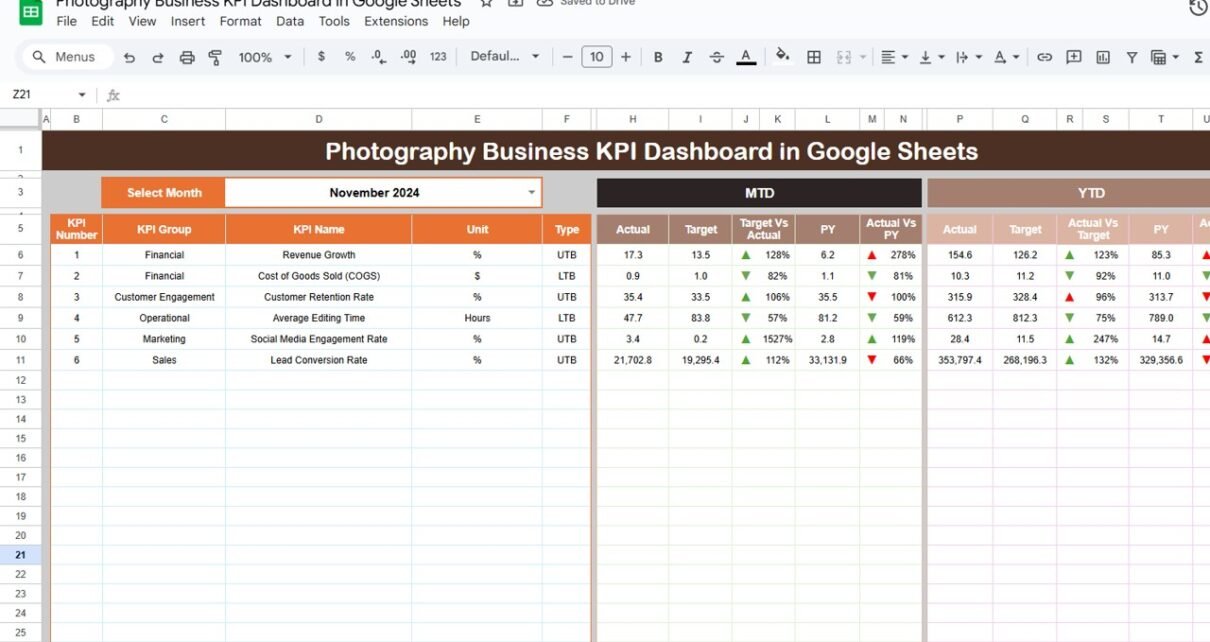
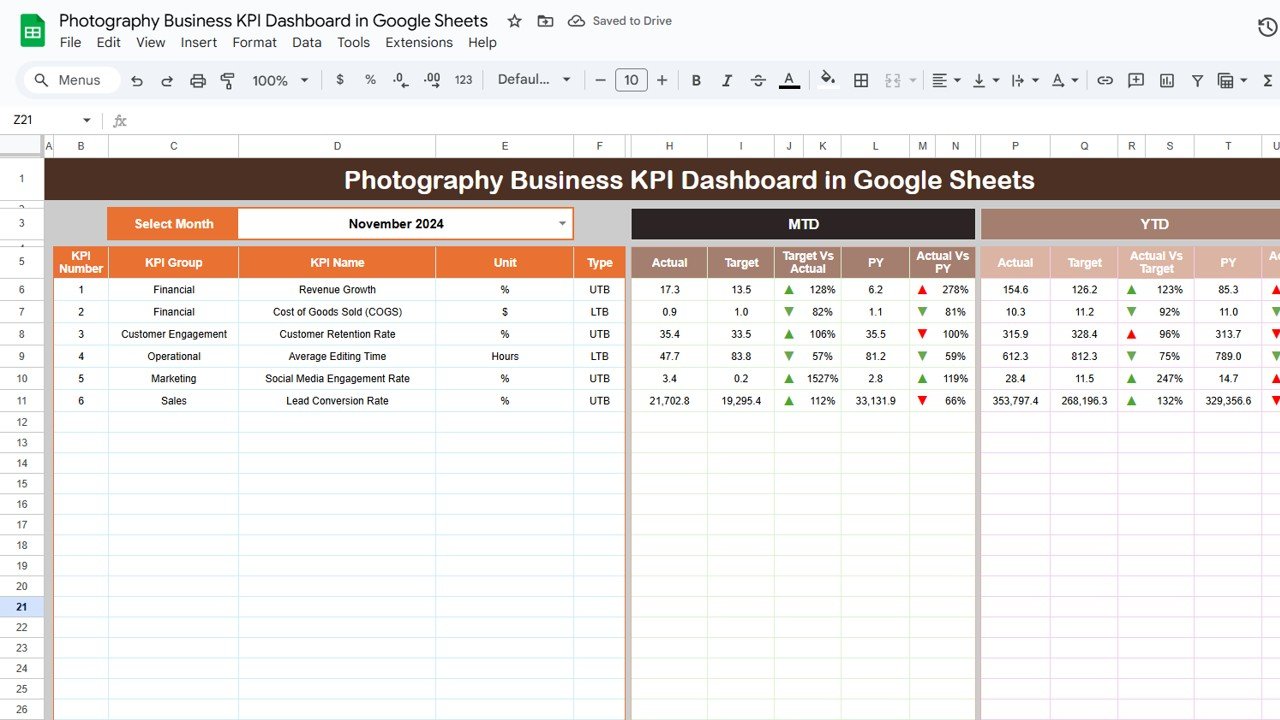
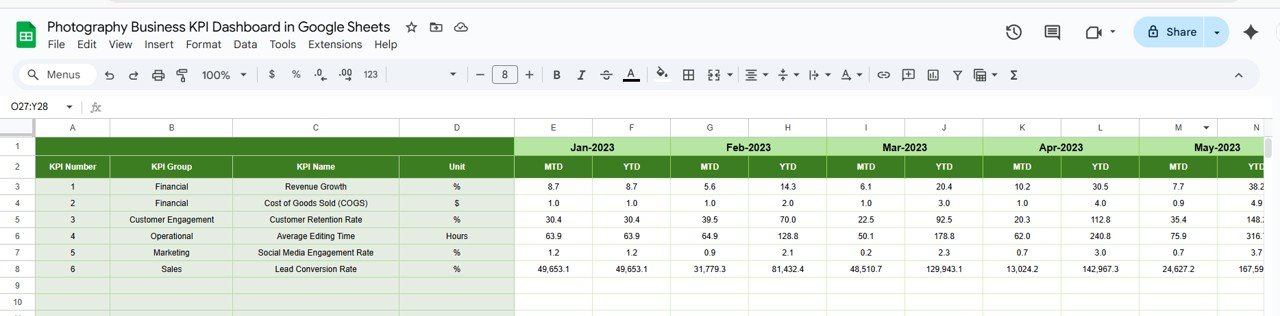
1. Dashboard Sheet Tab
-
The core visual reporting interface.
-
Dynamic month selector at cell D3.
-
MTD (Month-to-Date) Actual, Target, and Previous Year
-
YTD (Year-to-Date) Actual, Target, and Previous Year
-
Automatic calculations and conditional formatting:
- Green up arrows when performance improves
- Red down arrows when performance declines
Click to buy Photography Business KPI Dashboard in Google Sheets
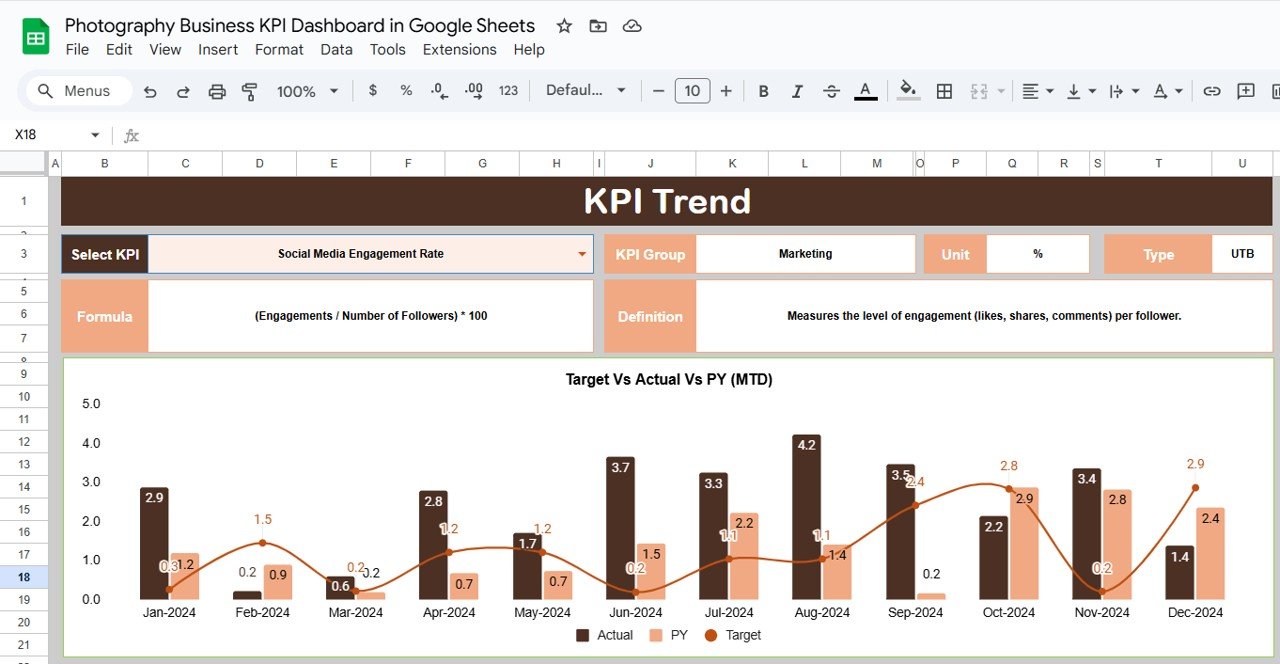
2. KPI Trend Sheet Tab
-
Select KPI from dropdown in cell C3.
-
KPI Group
-
Unit of measurement
-
Type (LTB – Lower the Better, UTB – Upper the Better)
-
Formula and definition
-
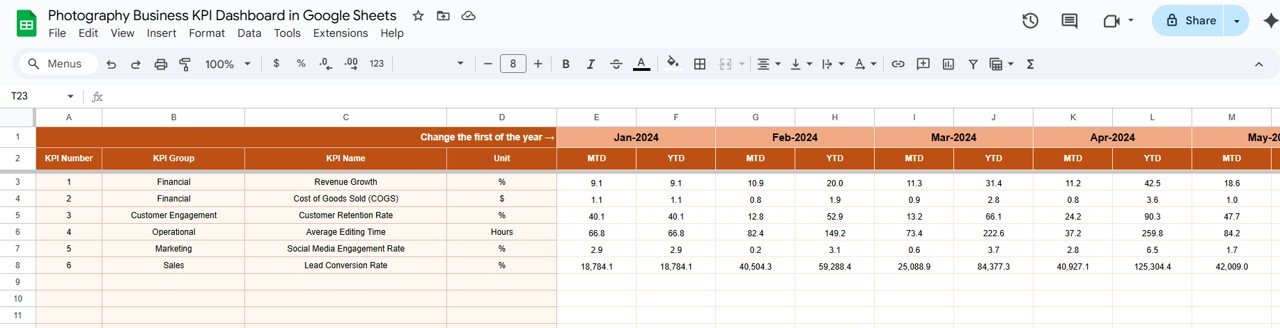
3. Actual Number Sheet Tab
-
Manual input of MTD and YTD actuals.
-
Set the first month of the year in cell E1.
-
Automatically maps data across months.
Click to buy Photography Business KPI Dashboard in Google Sheets
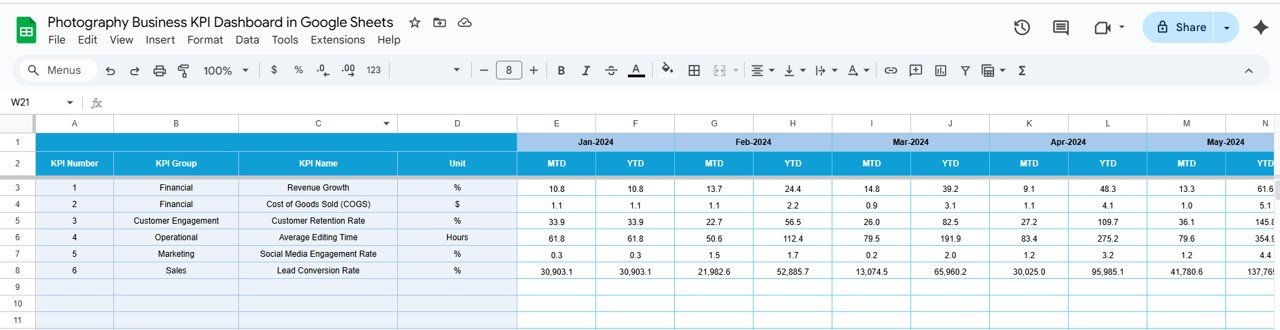
4. Target Sheet Tab
-
Enter monthly MTD and YTD targets for each KPI.
-
Essential for setting business goals.
5. Previous Year Number Sheet Tab
-
Store prior year’s data for year-over-year comparison.
-
Enhances strategic planning with historical perspective.
Click to buy Photography Business KPI Dashboard in Google Sheets
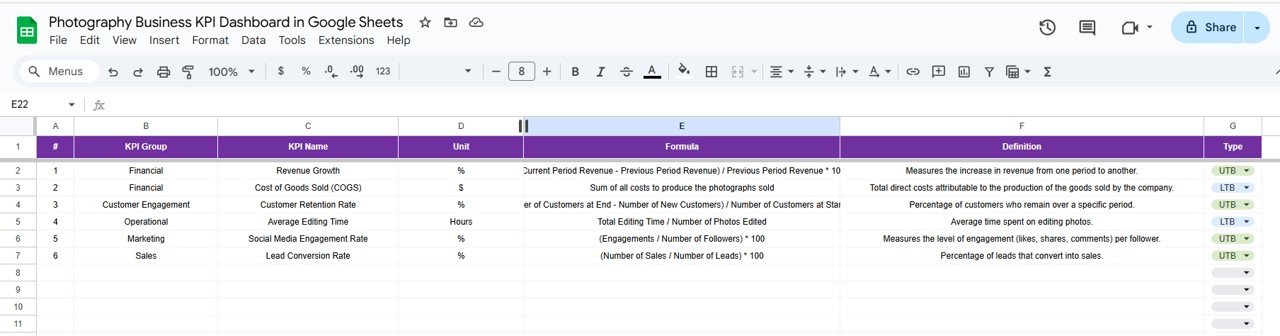
6. KPI Definition Sheet Tab
- KPI Name, Group, Unit
- Formula and Short Definition
- KPI Type (LTB or UTB)
Why Should You Track KPIs in Your Photography Business?
Without numbers, you’re guessing. KPIs help you:
-
Know what’s working and what’s not.
-
Improve financial and client performance.
-
Make informed decisions based on trends.
With this Google Sheets dashboard, you can now focus on strategy, not spreadsheets.
Advantages of the Photography Business KPI Dashboard in Google Sheets
Click to buy Photography Business KPI Dashboard in Google Sheets
Using this dashboard offers countless benefits:
-
No Expensive Software – Runs in Google Sheets.
-
Visual Reporting – Spot trends instantly.
-
Dynamic Controls – Easily filter by month or KPI.
-
Real-Time Feedback – Update numbers and see results instantly.
-
Year-over-Year Comparison – Compare actuals with historical benchmarks.
-
Improved Decision Making – Use facts, not feelings.
Opportunities for Improvement in the Dashboard
Even though this dashboard is powerful, here are a few areas where you can enhance it further:
-
Automation – Link the dashboard to Google Forms or CRM for real-time data input.
-
Client Feedback Integration – Add forms to capture satisfaction scores.
-
Image Library Stats – Track most-requested photo categories or themes.
-
Expense Tracking – Integrate monthly business costs for profitability analysis.
-
KPI Forecasting – Use historical trends to project future performance.
Best Practices for Using the Photography KPI Dashboard
Click to buy Photography Business KPI Dashboard in Google Sheets
To get the most value from this tool:
- Update Regularly: Enter your actuals and targets at the start of each month. Keeping it current ensures accurate results.
- Review Trends: Use the KPI Trend sheet to evaluate your progress over time and adjust strategies accordingly.
- Set Realistic Targets: Avoid over-ambitious targets. Base them on past performance and capacity.
- Train Your Team: If you work with others, train them to read and update the dashboard correctly.
- Backup Your Data: Create a copy each month to track history and prevent data loss.
Conclusion
In the modern photography business, creativity and analytics must go hand in hand. While you focus on capturing memories, let your Photography Business KPI Dashboard in Google Sheets focus on the numbers that drive your success.
With this dashboard, you’ll gain a clear view of your performance, uncover hidden opportunities, and stay ahead of the competition.
Start using this tool today—and turn your lens toward business growth. 📷📊
Frequently Asked Questions (FAQs)
Click to buy Photography Business KPI Dashboard in Google Sheets
Q1. Can beginners use this Photography KPI Dashboard?
Yes. It is designed for simplicity. If you know basic Google Sheets, you can start using it right away.
Q2. Can I add more KPIs?
Absolutely. Go to the KPI Definition sheet and add your new KPIs. Link them to other sheets using standard cell references or formulas.
Q3. Does it work on mobile?
Yes. You can view and edit the dashboard in the Google Sheets mobile app, although desktop use is recommended for full functionality.
Q4. How do I share it with my team?
Click on the “Share” button in the top-right of Google Sheets and provide access via email or link. You can also control edit/view-only permissions.
Q5. What if I want to connect this to a CRM or form?
You can link Google Forms, Zapier, or other no-code tools to Google Sheets for automated data updates.
Q6. Can I track my expenses in this dashboard?
Not by default. But you can add a new sheet tab to track expenses and integrate profit KPIs if needed.
Visit our YouTube channel to learn step-by-step video tutorials
Youtube.com/@NeotechNavigators
Watch the step-by-step video Demo:
Click to buy Photography Business KPI Dashboard in Google Sheets