Managing an investment portfolio without clear performance tracking creates uncertainty and weak decision-making. Portfolio managers, finance teams, analysts, and business owners need continuous visibility into returns, risks, costs, and growth trends. Because of this requirement, a Portfolio Performance KPI Dashboard in Google Sheets becomes an essential tool for monitoring investment health in a structured and reliable way.
This ready-to-use dashboard helps track portfolio returns, risk metrics, diversification levels, and efficiency indicators on a monthly and yearly basis. Moreover, it provides instant comparison between actual performance, targets, and previous-year results. Since the dashboard runs in Google Sheets, it remains flexible, collaborative, and cost-effective.
What Is a Portfolio Performance KPI Dashboard in Google Sheets?
A Portfolio Performance KPI Dashboard is a structured reporting system that consolidates all critical investment performance indicators into one interactive dashboard. It tracks how well a portfolio performs against defined targets and historical benchmarks.
This dashboard helps answer important questions such as:
- Are portfolio returns meeting expectations?
- Is risk increasing or decreasing over time?
- Are assets diversified properly?
- How does current performance compare with last year?
- Which investments require corrective action?
Because the dashboard is built in Google Sheets, users can update values easily, collaborate across teams, and view insights in real time without complex tools.
Key Features of the Portfolio Performance KPI Dashboard
Click to Buy Portfolio Performance KPI Dashboard in Google Sheets
This dashboard is designed with six structured worksheets, each serving a specific purpose in portfolio analysis.
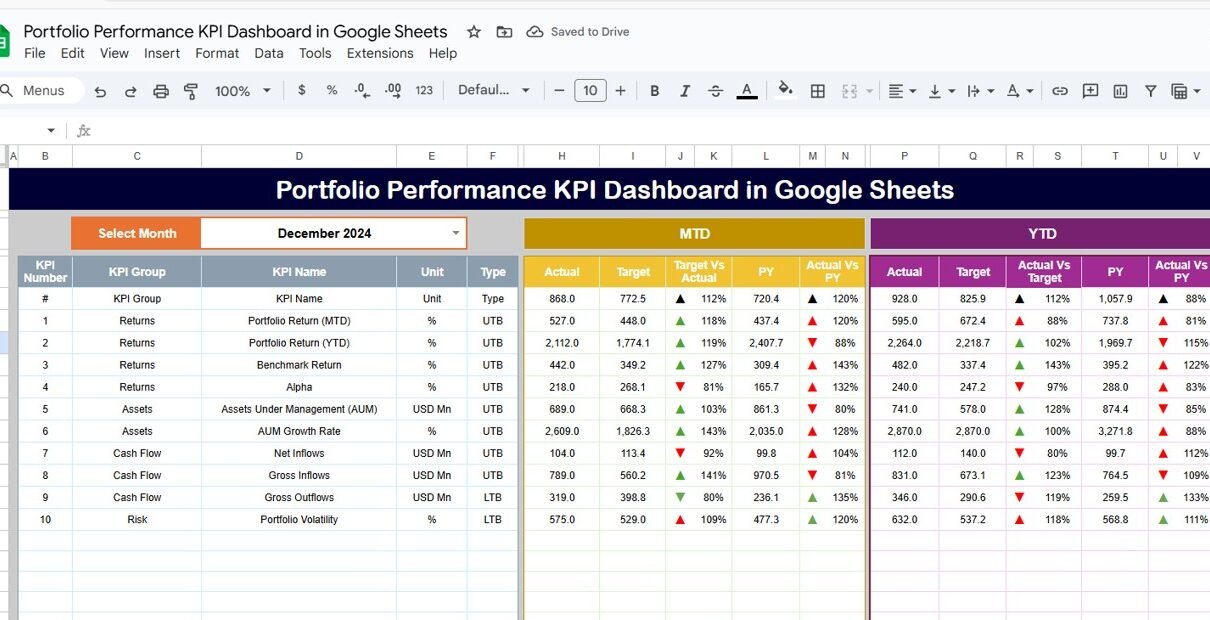
1. Dashboard Sheet Tab (Main Page)
The Dashboard Sheet is the central control panel. It provides a complete snapshot of portfolio performance.
Month Selector
-
Located in cell D3
-
When you select a month, the entire dashboard updates automatically
MTD (Month-to-Date) Metrics
-
MTD Actual
-
MTD Target
-
MTD Previous Year
-
Target vs Actual
-
Previous Year vs Actual
YTD (Year-to-Date) Metrics
-
YTD Actual
-
YTD Target
-
YTD Previous Year
-
Target vs Actual
-
Previous Year vs Actual
Conditional Formatting
-
Green arrows indicate improvement
-
Red arrows indicate decline
-
Neutral symbols indicate stable performance
This layout allows stakeholders to review portfolio performance in seconds without analyzing raw data.

Click to Buy Portfolio Performance KPI Dashboard in Google Sheets
2. KPI Trend Sheet Tab
The KPI Trend Sheet focuses on deep analysis of individual KPIs.
Dropdown Selection
-
Select a KPI from cell C3
Displayed Information
-
KPI Group
-
KPI Unit
-
KPI Type (Lower the Better or Upper the Better)
-
KPI Formula
-
KPI Definition
Trend Analysis
-
Month-wise trend visualization
-
Identifies volatility, consistency, and long-term movement
This sheet helps investors understand why performance changes over time.

Click to Buy Portfolio Performance KPI Dashboard in Google Sheets
3. Actual Number Sheet Tab
This sheet captures actual performance values.
Key Features
-
Enter MTD and YTD actual values
-
Select the first month of the year in cell E1
-
The sheet automatically aligns all months
This sheet acts as the primary data input source for real portfolio results.

4. Target Sheet Tab
The Target Sheet stores expected portfolio performance benchmarks.
Purpose
-
Define realistic return and risk targets
-
Set performance goals for each KPI
-
Compare actual performance against expectations
Targets guide investment strategy and performance evaluation.

Click to Buy Portfolio Performance KPI Dashboard in Google Sheets
5. Previous Year Number Sheet Tab
This sheet stores historical portfolio data.
Benefits
-
Enables year-over-year comparison
-
Highlights long-term growth trends
-
Identifies consistency or deterioration in performance
Historical comparison strengthens portfolio planning.

6. KPI Definition Sheet Tab
This sheet ensures clarity and consistency.
Stored Information
-
KPI Name
-
KPI Group
-
Unit
-
Formula
-
Definition
-
KPI Type (LTB / UTB)
This sheet acts as a reference guide for all stakeholders.

Click to Buy Portfolio Performance KPI Dashboard in Google Sheets
Advantages of Portfolio Performance KPI Dashboard in Google Sheets
-
Provides real-time performance visibility
-
Improves risk-adjusted decision-making
-
Simplifies reporting for stakeholders
-
Reduces dependency on complex tools
-
Enhances transparency and accountability
-
Supports long-term portfolio strategy
Opportunities for Improvement in Portfolio Performance Tracking
-
Integrate market data feeds
-
Add asset-level drill-down analysis
-
Include scenario and stress testing
-
Automate benchmark updates
-
Introduce forecasting and projections
These enhancements make the dashboard more strategic.
Best Practices for Using the Portfolio Performance Dashboard
Click to Buy Portfolio Performance KPI Dashboard in Google Sheets
-
Update actual data consistently
-
Set realistic performance targets
-
Review trends monthly and quarterly
-
Monitor risk metrics closely
-
Compare results with benchmarks
-
Maintain clear KPI definitions
Conclusion
A Portfolio Performance KPI Dashboard in Google Sheets delivers a structured, transparent, and data-driven approach to investment management. It allows portfolio managers and stakeholders to track returns, manage risks, and evaluate strategy effectiveness with confidence. Because the dashboard combines simplicity with powerful insights, it becomes a valuable tool for both individual investors and organizations.
When used correctly, this dashboard supports smarter decisions, stronger performance, and long-term portfolio success.
Frequently Asked Questions (FAQs)
Click to Buy Portfolio Performance KPI Dashboard in Google Sheets
1. Who should use a portfolio KPI dashboard?
Portfolio managers, analysts, finance teams, and investors.
2. Can I customize KPIs in Google Sheets?
Yes, the dashboard supports full customization.
3. Does this dashboard support long-term analysis?
Yes, YTD and previous-year comparisons enable trend analysis.
4. Is Google Sheets secure for portfolio data?
Yes, with proper access control and permissions.
5. Can this dashboard handle multiple portfolios?
Yes, with structured data separation.
Visit our YouTube channel to learn step-by-step video tutorials
Youtube.com/@NeotechNavigators
Watch the step-by-step video tutorial:
Click to Buy Portfolio Performance KPI Dashboard in Google Sheets