In today’s digital marketing world, businesses invest heavily in Pay-Per-Click (PPC) advertising to generate leads, drive website traffic, and increase revenue. However, running PPC campaigns without proper performance tracking often leads to wasted budgets and poor decision-making. Therefore, marketers need a structured system that monitors campaign performance clearly and consistently.
A PPC Campaign KPI Dashboard in Google Sheets provides a powerful yet simple solution. It helps marketers track advertising metrics, compare targets with actual performance, analyze trends, and make data-driven decisions — all within a familiar and easy-to-use environment.
In this detailed guide, you will learn everything about the PPC Campaign KPI Dashboard in Google Sheets, including its structure, KPIs, features, benefits, implementation steps, best practices, and frequently asked questions.
What Is a PPC Campaign KPI Dashboard in Google Sheets?
Click to Buy PPC Campaign KPI Dashboard in Google Sheets
A PPC Campaign KPI Dashboard in Google Sheets is an interactive performance tracking tool designed to monitor paid advertising campaigns using measurable Key Performance Indicators (KPIs).
Instead of reviewing multiple ad platform reports separately, marketers can analyze all campaign data in one centralized dashboard. As a result, teams gain better visibility into campaign performance and optimize advertising strategies faster.
Moreover, Google Sheets enables collaboration, automation, and real-time updates, making it ideal for marketing teams and agencies.
Why Do Businesses Need a PPC KPI Dashboard?
Running PPC campaigns involves managing multiple metrics such as clicks, conversions, cost, and return on investment. Without structured tracking, marketers struggle to understand which campaigns perform well.
A PPC dashboard helps organizations:
- Monitor campaign performance in real time
- Compare targets vs actual results
- Identify underperforming campaigns
- Optimize advertising budgets
- Improve ROI and conversion rates
- Simplify performance reporting
Consequently, businesses achieve better marketing outcomes while reducing unnecessary spending.
Key Features of the PPC Campaign KPI Dashboard in Google Sheets
This ready-to-use dashboard contains six structured worksheets, each serving a specific analytical purpose.
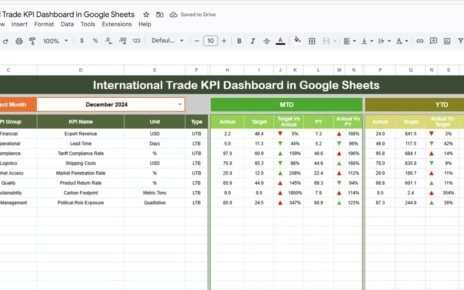
Dashboard Sheet Tab – The Main Performance Overview
The Dashboard Sheet acts as the central analysis page.
Key Functionalities
- Month selection dropdown available in cell D3
- Automatic update of dashboard metrics based on selected month
- Interactive KPI visualization
- Conditional formatting with up/down arrows
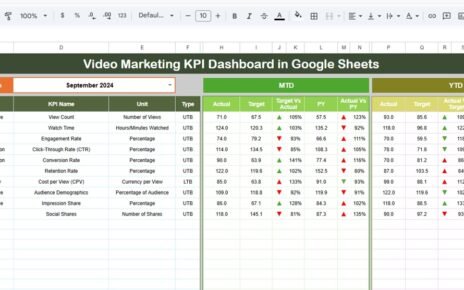
Metrics Displayed
The dashboard shows:
- MTD (Month-To-Date) Actual
- MTD Target
- MTD Previous Year
- Target vs Actual comparison
- Previous Year vs Actual comparison
Additionally, the dashboard also presents:
- YTD (Year-To-Date) Actual
- YTD Target
- YTD Previous Year comparisons
Because visual indicators highlight performance instantly, marketers quickly identify success or risk areas.

Click to Buy PPC Campaign KPI Dashboard in Google Sheets
KPI Trend Sheet – How Can You Analyze KPI Performance Over Time?
The KPI Trend Sheet allows detailed KPI-level analysis.
Features
- KPI selection dropdown in cell C3
- Automatic display of KPI details
- Trend performance visualization
Information Displayed
- KPI Group
- KPI Unit
- KPI Type (Lower the Better or Upper the Better)
- KPI Formula
- KPI Definition
Therefore, marketers understand both performance trends and KPI meaning in one place.

Click to Buy PPC Campaign KPI Dashboard in Google Sheets
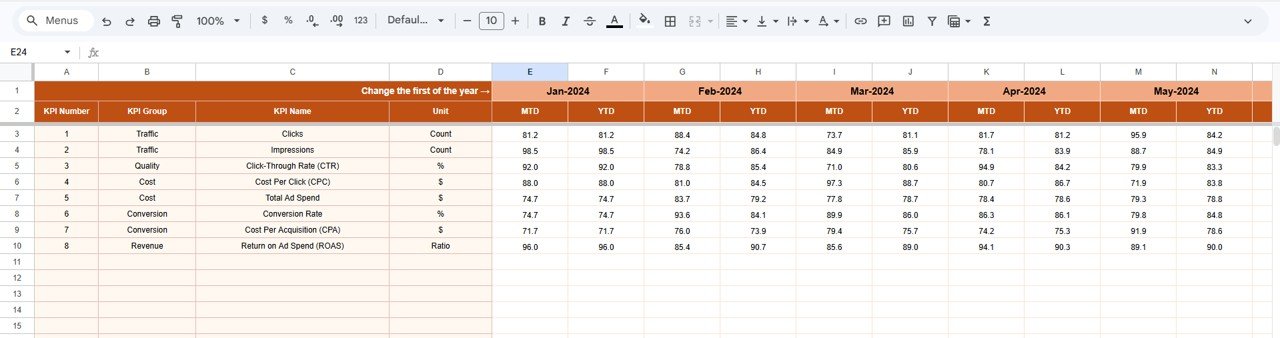
Actual Number Sheet – Where Do You Enter Campaign Performance Data?
The Actual Number Sheet stores real campaign results.
How It Works
- Enter MTD and YTD actual numbers
- Select first month of the year in cell E1
- Dashboard updates automatically after data entry
This structured approach ensures consistency and accuracy in reporting.
Target Sheet – Setting Campaign Goals
The Target Sheet defines expected performance levels.
Here users enter:
- Monthly targets for each KPI
- MTD and YTD target values
Because targets remain clearly defined, teams evaluate campaign success objectively.
Click to Buy PPC Campaign KPI Dashboard in Google Sheets
Previous Year Number Sheet – Why Compare Historical Data?
Historical comparison helps marketers understand performance growth.
In this sheet, users enter:
- Previous year campaign metrics
- Data structured similarly to current-year inputs
Consequently, marketers measure improvement trends and seasonal performance changes.

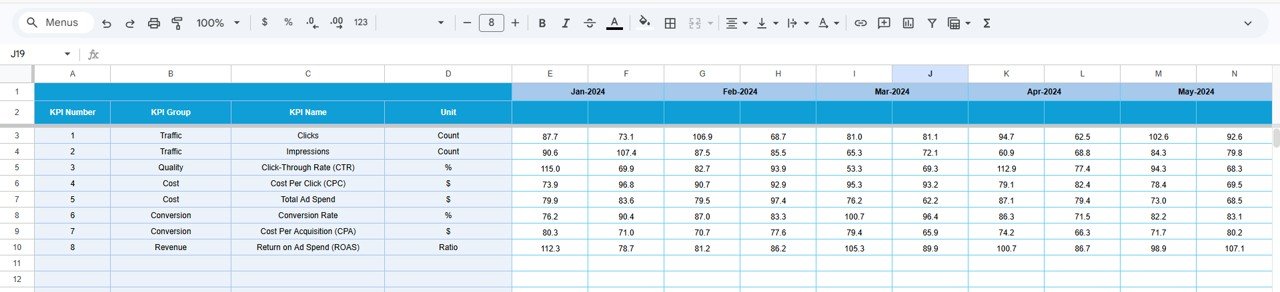
KPI Definition Sheet – The Foundation of KPI Management
The KPI Definition Sheet stores all KPI information.
Columns Included
- KPI Name
- KPI Group
- Unit
- Formula
- KPI Definition
- KPI Type (LTB or UTB)
This sheet standardizes KPI understanding across teams and prevents reporting confusion.

Click to Buy PPC Campaign KPI Dashboard in Google Sheets
Advantages of PPC Campaign KPI Dashboard in Google Sheets
Centralized Campaign Monitoring
All advertising metrics remain available in one dashboard.
Real-Time Collaboration
Teams access and update data simultaneously.
Easy Performance Comparison
Users compare Actual vs Target instantly.
Budget Optimization
Marketers identify high-performing campaigns quickly.
Cost-Effective Solution
Google Sheets eliminates expensive reporting tools.
Simple Customization
Users easily modify KPIs and layouts.
How Does the Dashboard Improve Marketing Decision-Making?
Click to Buy PPC Campaign KPI Dashboard in Google Sheets
Without structured analysis, marketers rely on assumptions. However, dashboards provide measurable insights.
The dashboard helps teams:
- Identify profitable campaigns
- Pause low-performing ads
- Allocate budgets efficiently
- Improve keyword strategy
- Optimize bidding decisions
Therefore, marketing becomes data-driven rather than guess-based.
Best Practices for the PPC Campaign KPI Dashboard in Google Sheets
Update Data Frequently
Daily or weekly updates improve accuracy.
Use Consistent Naming
Keep campaign and KPI names standardized.
Focus on Actionable KPIs
Avoid tracking unnecessary metrics.
Monitor Cost Metrics Closely
Control spending using CPC and CPA tracking.
Review Trends Monthly
Identify growth or decline patterns early.
Protect Formula Cells
Prevent accidental formula deletion.
Align KPIs with Business Goals
Ensure metrics support revenue objectives.
Who Can Benefit from This Dashboard?
Click to Buy PPC Campaign KPI Dashboard in Google Sheets
This dashboard suits:
- Digital Marketing Agencies
- PPC Specialists
- Marketing Managers
- E-commerce Businesses
- Startup Founders
- Performance Marketers
- Advertising Consultants
Because Google Sheets works online, teams collaborate easily from anywhere.
Why Use Google Sheets Instead of Complex Marketing Tools?
Many organizations choose Google Sheets because:
- No installation required
- Cloud-based collaboration
- Easy sharing and access control
- Flexible customization
- Integration with marketing exports
- Low learning curve
Therefore, businesses gain professional analytics without technical complexity.
Conclusion
Click to Buy PPC Campaign KPI Dashboard in Google Sheets
The PPC Campaign KPI Dashboard in Google Sheets transforms campaign tracking into a structured, visual, and data-driven process. Instead of reviewing scattered advertising reports, marketers gain centralized insights into performance, costs, and results.
Because the dashboard combines automation, KPI tracking, and trend analysis, teams make faster and smarter marketing decisions. Furthermore, businesses improve ROI, optimize budgets, and scale advertising strategies confidently.
Ultimately, organizations that adopt PPC dashboards move from reactive marketing to strategic performance management.
Frequently Asked Questions (FAQs)
Click to Buy PPC Campaign KPI Dashboard in Google Sheets
What is a PPC KPI Dashboard?
It is a reporting tool that tracks advertising performance using measurable KPIs.
Can beginners use this dashboard?
Yes. Anyone with basic Google Sheets knowledge can use it easily.
Does the dashboard update automatically?
Yes, once data is entered, charts and KPIs update automatically.
Can I customize KPIs?
Yes. You can modify KPI definitions and targets anytime.
Is it suitable for agencies?
Absolutely. Agencies can manage multiple client campaigns efficiently.
How often should data be updated?
Weekly updates work best, although daily updates provide deeper insights.
Does it help improve ROI?
Yes. Performance comparisons help optimize budgets and campaigns.
Can I track multiple campaigns?
Yes. The dashboard supports multiple campaign entries.
Visit our YouTube channel to learn step-by-step video tutorials
Youtube.com/@NeotechNavigators
Watch the step-by-step video tutorial: