Running a preschool is not only about nurturing young minds — it’s also about ensuring smooth operations, satisfied parents, and consistent educational outcomes. From tracking student enrollment and attendance to managing teacher performance and classroom efficiency, every aspect needs to be monitored closely. That’s where a Preschool KPI Dashboard in Google Sheets becomes an invaluable tool.
This article explains everything you need to know about creating and using a Preschool KPI Dashboard in Google Sheets — including its structure, key features, advantages, best practices, and frequently asked questions.
Click to buy Preschool KPI Dashboard in Google Sheets
What Is a Preschool KPI Dashboard in Google Sheets?
A Preschool KPI Dashboard in Google Sheets is a visual performance monitoring tool that helps school administrators, teachers, and owners track key performance indicators (KPIs) across various operational areas.
It consolidates essential data — such as enrollment numbers, attendance, student-teacher ratios, parent satisfaction, and operational costs — into one easy-to-read dashboard.
Instead of juggling multiple spreadsheets, administrators can now analyze performance trends, compare monthly and yearly results, and make informed decisions quickly.
Because it’s built in Google Sheets, the dashboard is cloud-based, easy to share, and fully customizable — making it perfect for schools of any size.
Why Do Preschools Need a KPI Dashboard?
Running a preschool involves managing academic goals, operations, and communication with parents — all at once. However, without measurable insights, it’s hard to identify what’s working and what’s not.
A KPI dashboard turns raw data into meaningful visuals, enabling educators to:
-
Measure student outcomes
-
Monitor attendance trends
-
Evaluate teacher and staff performance
-
Track financial health
-
Improve resource allocation
-
Strengthen parent engagement
By converting numbers into insights, the Preschool KPI Dashboard supports data-driven decision-making — ensuring every child’s learning experience is both joyful and effective.
Structure of the Preschool KPI Dashboard in Google Sheets
The Preschool KPI Dashboard consists of six main worksheets, each designed to capture, calculate, and visualize key information seamlessly.
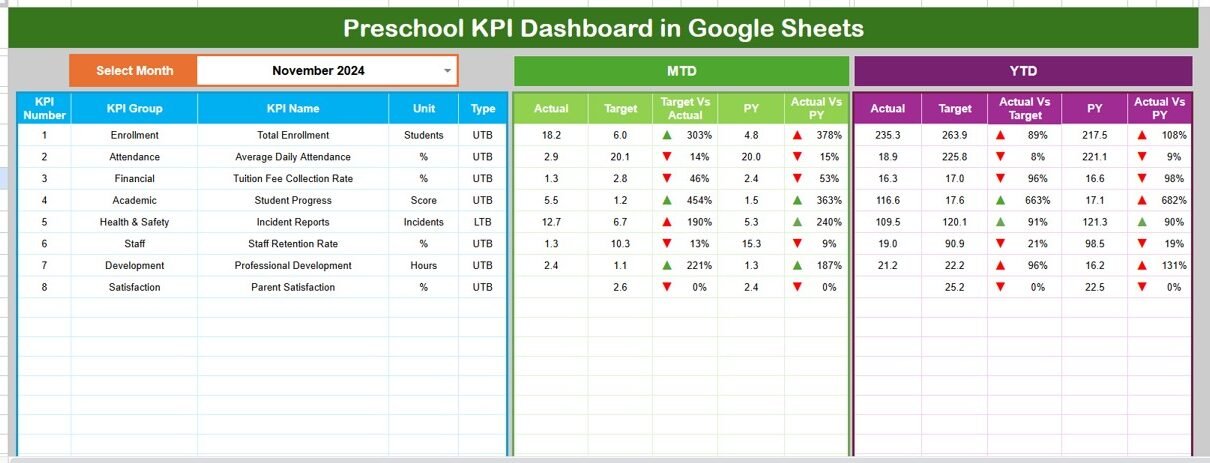
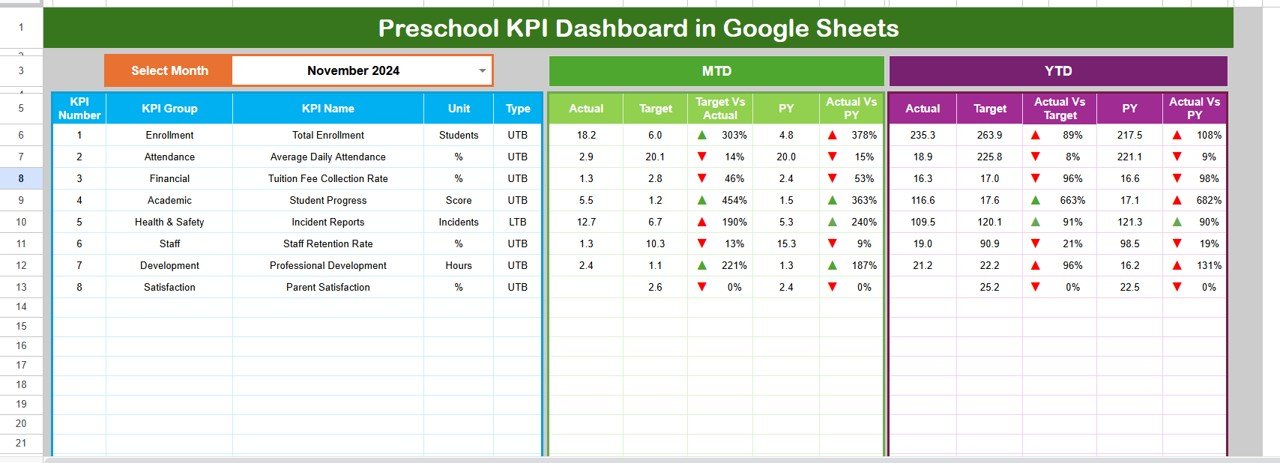
Dashboard Sheet Tab
This is the main control panel of your preschool KPI system.
-
It displays all key metrics (MTD and YTD) in one view.
-
You can select a month from the drop-down in cell D3.
-
The dashboard automatically updates to reflect that month’s data.
-
It includes Actual, Target, and Previous Year values for each KPI.
-
Conditional formatting uses arrows or color indicators to show performance trends.
The dashboard shows comparisons like:
-
Target vs Actual (How the school is performing against its set goals)
-
PY vs Actual (How the school is doing compared to last year)
Click to buy Preschool KPI Dashboard in Google Sheets
This enables quick visual insights into where improvement is needed and where progress is being made.
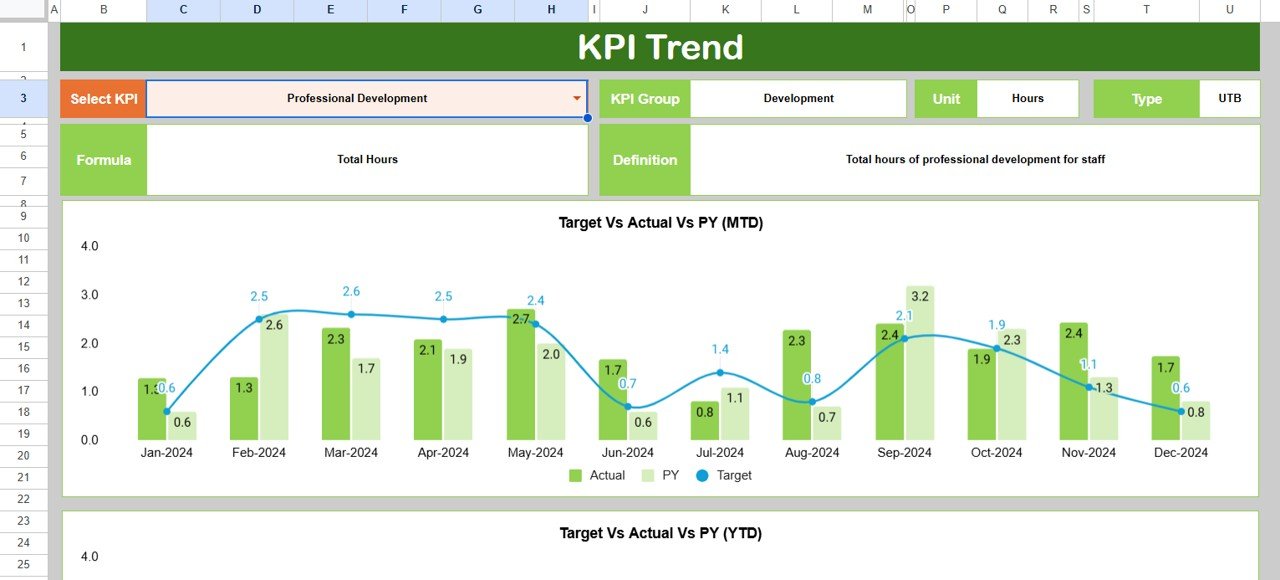
Trend Sheet Tab
The Trend Sheet is where you analyze KPI progress over time.
-
It includes a drop-down menu (cell C3) to select a KPI name.
-
Displays KPI details such as:
- KPI Group
- Unit of measurement
- KPI Type: Upper the Better (UTB) or Lower the Better (LTB)
- Formula used
- KPI Definition
-
The sheet also contains dynamic MTD and YTD trend charts showing Actual, Target, and Previous Year figures.
This helps you visualize how performance has evolved throughout the academic year.
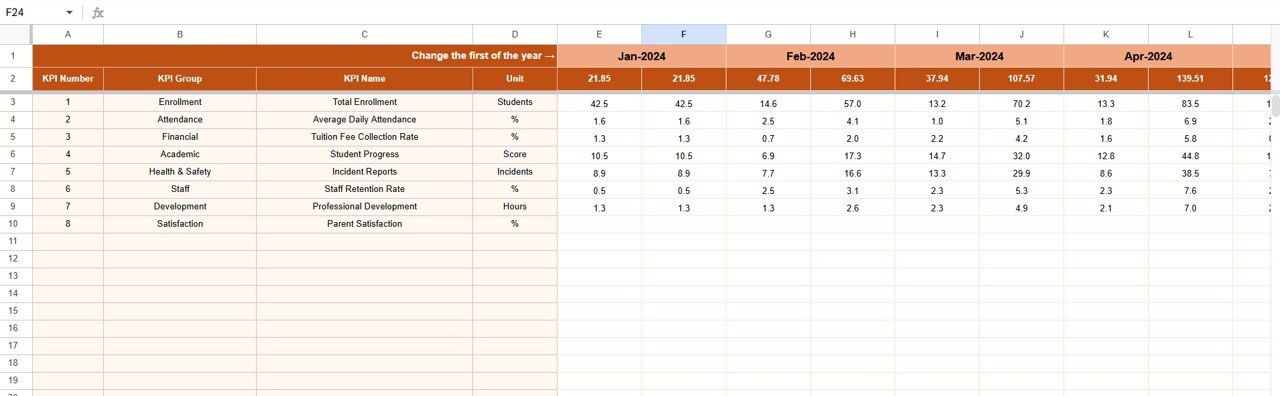
Actual Numbers Input Sheet
This is where monthly performance data is entered.
-
Input actual figures for MTD and YTD for each KPI.
-
The month can be changed easily using the selector in cell E1.
-
Data entered here feeds automatically into all dashboard calculations.
This tab is the foundation for accurate performance tracking. It ensures your dashboard always reflects real, up-to-date numbers.
Click to buy Preschool KPI Dashboard in Google Sheets
Target Sheet Tab
The Target Sheet defines your preschool’s performance goals.
-
Enter monthly and yearly targets for each KPI.
-
The dashboard compares these values against actual results.
-
Targets help management and staff align on specific performance expectations.
By tracking how close your preschool is to meeting targets, you can reward success, identify issues early, and plan improvement actions effectively.
Previous Year Numbers Sheet Tab
Historical data is crucial for understanding growth trends.
-
This sheet stores all previous year’s KPI values.
-
It allows the dashboard to calculate year-over-year comparisons.
-
Trends in student admissions, attendance, or satisfaction can be tracked effortlessly.
With this information, school leaders can see how changes in policies, staff, or curriculum have influenced performance over time.
KPI Definition Sheet Tab
This is your reference sheet that clearly defines each KPI.
It includes:
-
KPI Name
-
KPI Group (e.g., Academic, Financial, Operational)
-
Unit of Measurement
-
Formula Used
-
Definition and Interpretation
Having clear definitions ensures that everyone — from administrators to teachers — understands what each metric represents and how it’s calculated. This transparency builds consistency in data reporting and interpretation.
Advantages of a Preschool KPI Dashboard in Google Sheets
Implementing a Preschool KPI Dashboard offers several benefits that can transform how your preschool operates.
Centralized Performance Tracking
All essential data — attendance, learning outcomes, and finances — can be viewed in one place, reducing the need to navigate multiple spreadsheets.
Real-Time Decision Making
Since Google Sheets is cloud-based, administrators can see updated data in real time and respond quickly to performance changes.
Easy Customization
Schools can modify KPI definitions, formulas, or chart visuals as per their unique needs without using complex software.
Enhanced Accountability
By assigning responsibility for each KPI, teachers and staff become more aware of their roles in achieving school goals.
Cost-Effective Solution
No expensive software or licenses are needed — just Google Sheets, which most institutions already use.
Improved Communication
Visual dashboards make it easy to share insights with parents, management, and teachers, promoting transparency and trust.
How to Use the Preschool KPI Dashboard Effectively
To make the most of your dashboard, follow these steps:
-
Gather Reliable Data: Ensure accuracy in monthly data entry.
-
Define Clear Targets: Set measurable and realistic performance goals.
-
Review Trends Regularly: Use the trend sheet to identify seasonal or long-term patterns.
-
Encourage Staff Participation: Involve teachers in reviewing KPI outcomes.
-
Take Corrective Actions: Address problem areas promptly when KPIs fall below targets.
-
Automate Updates: Use simple formulas and conditional formatting to minimize manual effort.
These practices ensure your dashboard stays reliable and insightful.
Best Practices for a Preschool KPI Dashboard
Follow these best practices to maintain consistency and effectiveness in your dashboard:
Keep It Simple
Avoid clutter. Include only the most relevant KPIs that directly impact learning and operations.
Use Visual Indicators
Conditional formatting (green for success, red for concern) helps you interpret results instantly.
Ensure Data Accuracy
Cross-check entries regularly. One incorrect value can distort insights.
Review Monthly and Annually
Conduct MTD and YTD performance reviews to assess short- and long-term results.
Maintain Historical Data
Use previous year sheets for comparison. Historical analysis helps measure growth and improvement.
Train Your Team
Ensure everyone understands how to read and interpret the dashboard.
Protect Sensitive Information
Use Google Sheets sharing permissions to limit access to authorized staff only.
By following these best practices, your dashboard remains both practical and professional.
Conclusion
The Preschool KPI Dashboard in Google Sheets is more than just a spreadsheet — it’s a powerful management tool that transforms data into direction.
It helps school leaders make informed decisions, track performance across multiple areas, and create a culture of continuous improvement.
By visualizing KPIs like enrollment, attendance, satisfaction, and operational efficiency, preschools can ensure they deliver quality education while maintaining administrative excellence.
Whether you’re running a small preschool or managing multiple centers, this Google Sheets dashboard gives you the clarity and control needed to thrive in today’s education landscape.
Frequently Asked Questions (FAQs)
What is a Preschool KPI Dashboard used for?
It’s used to monitor and evaluate key performance indicators like student attendance, enrollment, satisfaction, and teacher ratios in a single, interactive Google Sheets dashboard.
Can I customize KPIs in the dashboard?
Yes. You can easily add, remove, or modify KPIs in the definition sheet and formulas as per your preschool’s unique goals.
How often should I update the data?
Ideally, you should update it monthly for MTD analysis and review it quarterly or yearly for YTD performance tracking.
Does the dashboard require advanced Excel or coding skills?
No. It’s designed for non-technical users. Basic Google Sheets knowledge is enough to manage and update it.
What’s the main difference between MTD and YTD in this dashboard?
-
MTD (Month-to-Date): Tracks performance within the current month.
-
YTD (Year-to-Date): Shows cumulative performance from the start of the year to date.
How does the dashboard help in decision-making?
It highlights whether your preschool is meeting its goals, which areas need attention, and how performance compares to past years — enabling data-driven decisions.
Is the Preschool KPI Dashboard free to use?
If you create it yourself using Google Sheets, it’s free. However, professionally designed templates offer pre-built formulas, charts, and visuals for instant use.
Visit our YouTube channel to learn step-by-step video tutorials