Pricing decisions directly affect revenue, profitability, and market competitiveness. However, many organizations still rely on intuition, static reports, or disconnected spreadsheets to evaluate pricing performance. As a result, they miss opportunities to optimize margins, respond to market changes, and align pricing with business goals.
That is exactly why a Pricing Strategy KPI Dashboard in Google Sheets becomes a powerful decision-making tool.
This ready-to-use dashboard converts pricing data into meaningful KPIs, comparisons, and trends. It helps pricing managers, finance teams, and business leaders track performance, measure effectiveness, and improve pricing strategies using real data—without expensive software.
In this article, you will learn what a Pricing Strategy KPI Dashboard is, how it works, which KPIs it tracks, how each worksheet functions, its advantages, opportunities for improvement, best practices, and frequently asked questions.
What Is a Pricing Strategy KPI Dashboard in Google Sheets?
A Pricing Strategy KPI Dashboard is a structured analytics tool that measures how well pricing decisions perform against targets and historical benchmarks. It tracks price effectiveness, margin impact, revenue outcomes, and customer response.
Because this dashboard runs in Google Sheets, it offers:
- Real-time collaboration
- Automated KPI calculations
- Month-to-Date (MTD) and Year-to-Date (YTD) tracking
- Target vs Actual analysis
- Previous-year performance comparison
- Visual performance indicators
As a result, pricing decisions become data-driven instead of reactive.
Key Features of the Pricing Strategy KPI Dashboard
Click to Buy Pricing Strategy KPI Dashboard in Google Sheets
This dashboard uses 6 structured worksheets, each designed for a specific pricing analysis purpose.
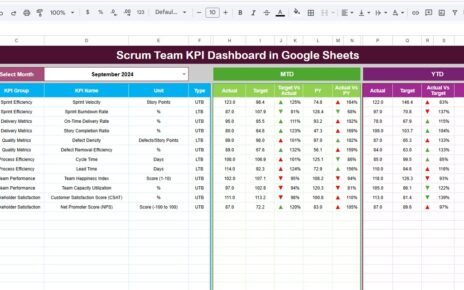
1. Dashboard Sheet Tab (Main Dashboard)
The Dashboard Sheet provides a consolidated view of all pricing KPIs.
Month Selection
-
Cell D3 contains a month dropdown.
-
All KPI values update automatically when you select a different month.
MTD Performance Section
- Actual
- Target
- Previous Year
- Target vs Actual
- Previous Year vs Actual
YTD Performance Section
- Actual
- Target
- Previous Year
- Target vs Actual
- Previous Year vs Actual
Conditional formatting with up and down arrows helps users instantly identify performance changes:
-
Green arrow → favorable trend
-
Red arrow → unfavorable trend
This sheet enables leadership to evaluate pricing health at a glance.

Click to Buy Pricing Strategy KPI Dashboard in Google Sheets
2. KPI Trend Sheet Tab
The KPI Trend Sheet focuses on detailed KPI analysis.
How It Works
Select a KPI from the dropdown in cell C3
The dashboard displays:
- KPI Group
- KPI Unit
- KPI Type (Upper the Better / Lower the Better)
- KPI Formula
- KPI Definition
Trend charts show month-wise movement, making it easy to identify pricing patterns and risks.

Click to Buy Pricing Strategy KPI Dashboard in Google Sheets
3. Actual Number Sheet Tab
This sheet stores actual pricing performance values.
Key Features
-
Enter MTD and YTD actual values
-
Select the first month of the year in cell E1
-
All KPIs recalculate automatically
This structure ensures consistency and accuracy throughout the year.

Click to Buy Pricing Strategy KPI Dashboard in Google Sheets
4. Target Sheet Tab
The Target Sheet defines expected pricing performance.
Why This Matters
-
Sets clear pricing objectives
-
Aligns teams with margin and revenue goals
-
Enables performance accountability
Targets can change monthly or annually based on strategy.

Click to Buy Pricing Strategy KPI Dashboard in Google Sheets
5. Previous Year Number Sheet Tab
This sheet contains last year’s pricing data.
Benefits
-
Year-over-year pricing comparison
-
Market trend analysis
-
Seasonal performance evaluation
Historical context strengthens pricing decisions.

Click to Buy Pricing Strategy KPI Dashboard in Google Sheets
6. KPI Definition Sheet Tab
This sheet acts as the single source of truth.
It contains:
- KPI Name
- KPI Group
- Unit
- Formula
- KPI Definition
- KPI Type (UTB / LTB)
It ensures everyone interprets pricing KPIs consistently.

Click to Buy Pricing Strategy KPI Dashboard in Google Sheets
Advantages of Pricing Strategy KPI Dashboard
-
Centralized pricing performance tracking
-
Better margin visibility
-
Faster pricing decisions
-
Improved revenue forecasting
-
Reduced reliance on intuition
-
Easy collaboration across teams
-
No costly BI tools required
Opportunities for Improvement in Pricing Strategy Dashboard
Click to Buy Pricing Strategy KPI Dashboard in Google Sheets
Organizations can enhance this dashboard by:
-
Adding customer-segment pricing analysis
-
Tracking regional price differences
-
Integrating cost volatility indicators
-
Including promotion effectiveness KPIs
-
Adding predictive pricing models
Best Practices for Using the Pricing Strategy KPI Dashboard
-
Update pricing data regularly
-
Review KPIs monthly
-
Align targets with market strategy
-
Monitor discount trends closely
-
Compare performance with previous year
-
Train teams on KPI interpretation
Conclusion
Click to Buy Pricing Strategy KPI Dashboard in Google Sheets
A Pricing Strategy KPI Dashboard in Google Sheets provides a clear and structured way to measure pricing effectiveness. It turns complex pricing data into actionable insights, helping organizations protect margins, improve competitiveness, and drive sustainable revenue growth.
Because it is flexible, collaborative, and easy to maintain, this dashboard suits organizations of all sizes. With disciplined usage and the right KPIs, pricing decisions become smarter, faster, and more profitable.
Frequently Asked Questions (FAQs)
Click to Buy Pricing Strategy KPI Dashboard in Google Sheets
1. Who should use a Pricing Strategy KPI Dashboard?
Pricing managers, finance teams, sales leaders, and executives.
2. Can this dashboard support different pricing models?
Yes, it supports fixed, dynamic, and discount-based pricing.
3. Does it support MTD and YTD tracking?
Yes, both views are fully built-in.
4. Can KPIs be customized?
Yes, the KPI Definition sheet allows full customization.
5. Is Google Sheets secure for pricing data?
Yes, with proper access controls and permissions.
Visit our YouTube channel to learn step-by-step video tutorials
Youtube.com/@NeotechNavigators
Watch the step-by-step video tutorial:
Click to Buy Pricing Strategy KPI Dashboard in Google Sheets