Managing procurement efficiently is a critical task for any business. To help procurement professionals track and evaluate their performance, a Procurement KPI Dashboard is an excellent tool. Google Sheets offers a flexible platform for building and customizing such dashboards, allowing users to easily input, update, and visualize key performance indicators (KPIs).
In this article, we’ll walk you through the creation and use of a Procurement KPI Dashboard in Google Sheets. We’ll discuss the key features of the dashboard, explain various KPIs, and provide detailed insights into best practices, advantages, and opportunities for improvement.
What is a Procurement KPI Dashboard?
A Procurement KPI Dashboard is a powerful tool that helps businesses monitor and evaluate the effectiveness of their procurement processes. It consolidates various metrics that can provide real-time insights into procurement activities, such as purchase order fulfillment, supplier performance, cost savings, and more.
This dashboard is especially helpful for procurement managers, as it allows them to track key indicators over time, compare actual performance against targets, and make data-driven decisions.
Key Features of the Procurement KPI Dashboard in Google Sheets
Click to buy Procurement KPI Dashboard in Google Sheets
We’ve designed a ready-to-use Procurement KPI Dashboard in Google Sheets, which comes with the following features:
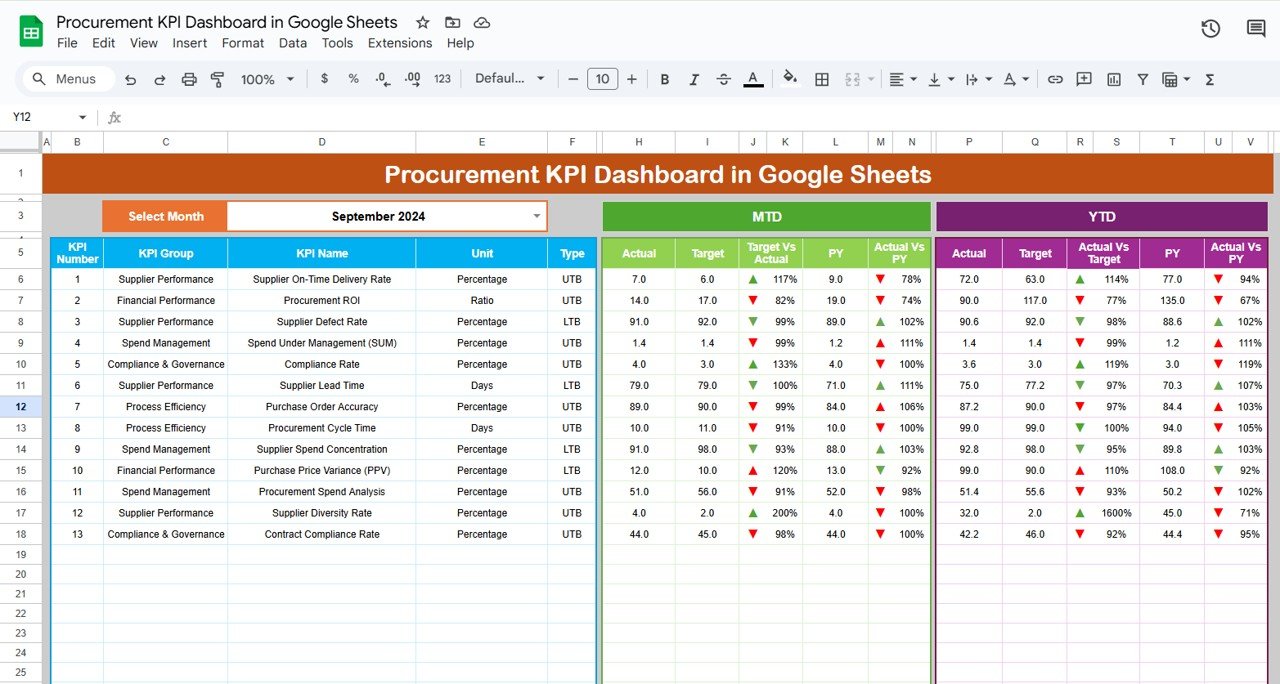
1. Dashboard Sheet Tab
This is the main sheet tab, where you will see the most important metrics and KPIs for your procurement activities. The dashboard includes:
-
Month Selection: You can select the month from the dropdown in cell D3. When the month is selected, all the numbers in the dashboard will update to reflect data for that month.
-
Key Metrics: This section displays MTD (Month-to-Date) Actuals, Targets, and Previous Year Data, alongside Target vs. Actual and Previous Year vs. Actual with conditional formatting that shows up and down arrows.
-
YTD (Year-to-Date) Metrics: Similar to MTD, you will see YTD Actuals, Targets, and Previous Year Data, along with comparative arrows for Target vs. Actual and Previous Year vs. Actual.
Click to buy Procurement KPI Dashboard in Google Sheets
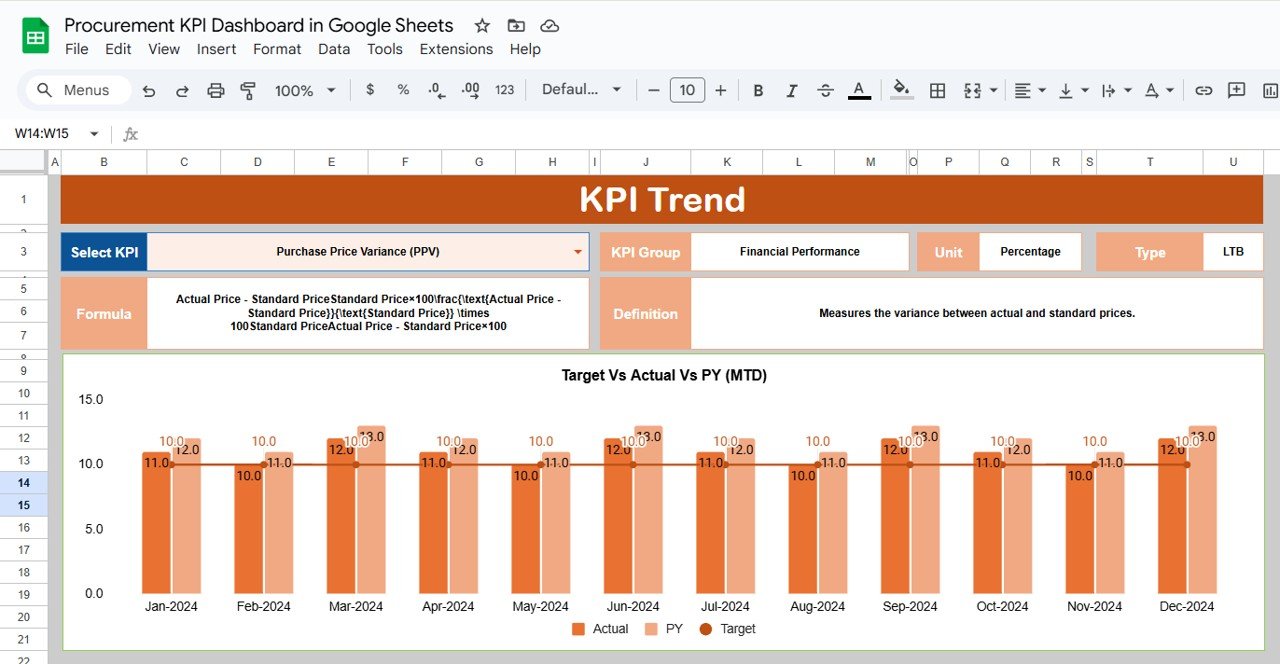
2. KPI Trend Sheet Tab
Here, you can track the trends of your KPIs over time. It allows you to:
-
Select the KPI Name from a dropdown in C3.
-
View the KPI Group, Unit, Type (whether “Lower the Better” or “Upper the Better”), and Formula.
-
Understand the KPI Definition and its purpose.
Click to buy Procurement KPI Dashboard in Google Sheets
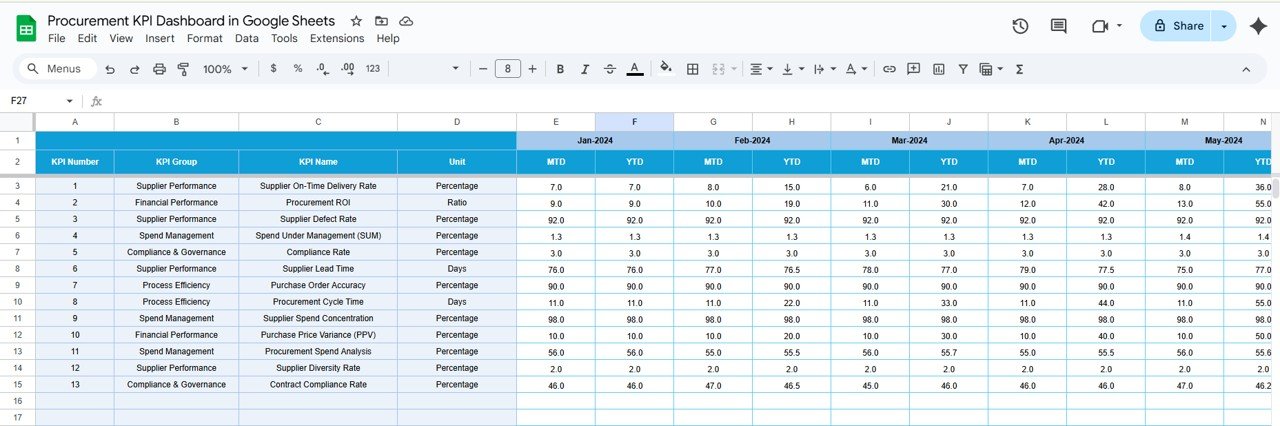
3. Actual Numbers Sheet Tab
This sheet allows you to input actual procurement numbers for both YTD and MTD for each month. The month is selected in E1, and you can easily update the numbers accordingly.

Click to buy Procurement KPI Dashboard in Google Sheets
4. Target Sheet Tab
Here, you enter your target numbers for each KPI, both for MTD and YTD, to help compare actual performance against set targets.
Click to buy Procurement KPI Dashboard in Google Sheets
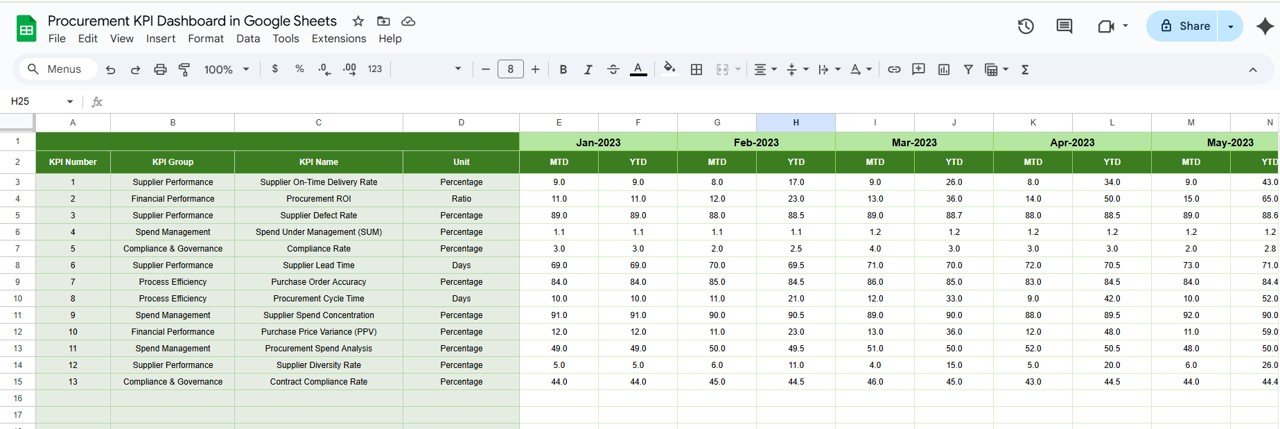
5. Previous Year Numbers Sheet Tab
This sheet allows you to input the same metrics from the previous year to make year-on-year comparisons.
Click to buy Procurement KPI Dashboard in Google Sheets
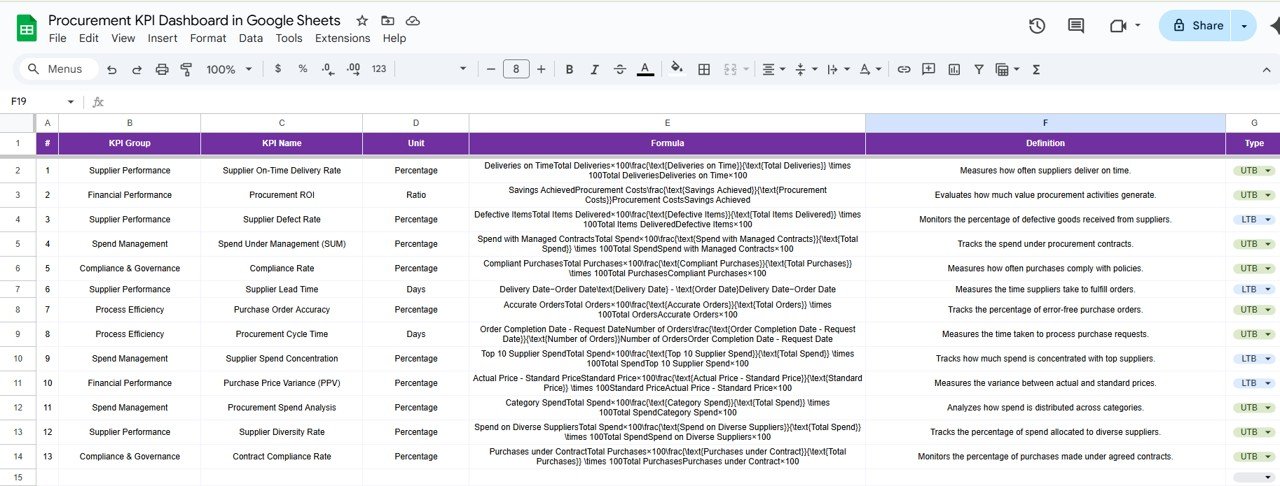
6. KPI Definition Sheet Tab
In this tab, you define each KPI, including:
-
KPI Name
-
KPI Group
-
Unit
-
Formula
-
KPI Definition
Click to buy Procurement KPI Dashboard in Google Sheets
Advantages of Using a Procurement KPI Dashboard
Using a Procurement KPI Dashboard in Google Sheets provides numerous benefits to procurement teams and businesses. Below are some of the key advantages:
- Real-Time Tracking and Insights: With the dashboard, procurement teams can track their performance in real time, allowing them to make quick decisions and adjustments as needed.
- Clear Visualization of Data: By visualizing key metrics such as actual vs. target and year-over-year comparisons, businesses can better understand their procurement performance and trends.
- Improved Decision Making: The dashboard helps procurement professionals make data-driven decisions by providing clear insights into various KPIs and their trends over time.
- Time-Saving and Automation: Google Sheets allows easy automation of calculations, reducing the need for manual data entry and improving overall efficiency.
- Customization and Flexibility: The dashboard is highly customizable. Users can modify it to suit their specific business requirements, from adding new KPIs to adjusting formulas.
Opportunities for Improvement in Procurement KPI Dashboard
Click to buy Procurement KPI Dashboard in Google Sheets
While the Procurement KPI Dashboard is a valuable tool, there are always opportunities to enhance its capabilities:
- Integration with Other Systems: Integrating the dashboard with procurement software, ERP systems, or supply chain management tools can provide real-time data updates and minimize manual entries.
- Improved Data Security: Although Google Sheets provides cloud-based access, ensuring that sensitive procurement data is secure should always be a priority. Implementing proper user roles and permissions can help mitigate risks.
- Advanced Visualizations: Consider integrating advanced data visualization tools, such as charts, graphs, and heatmaps, to make the dashboard even more interactive and insightful.
- Mobile Optimization: Making the dashboard mobile-friendly will ensure procurement professionals can access data on the go, which is particularly helpful in fast-paced environments.
Best Practices for Creating a Procurement KPI Dashboard
Click to buy Procurement KPI Dashboard in Google Sheets
To make the most of your Procurement KPI Dashboard, follow these best practices:
- Keep It Simple: Avoid overloading the dashboard with too many KPIs. Focus on the most impactful metrics that can drive meaningful decision-making.
- Ensure Data Accuracy: Ensure that the data entered into the dashboard is accurate and up-to-date. Regularly update actual numbers and review targets to reflect current business goals.
- Use Conditional Formatting Effectively: Take full advantage of Google Sheets’ conditional formatting features to highlight KPIs that require attention, such as those falling below targets or showing negative trends.
- Provide Context: Add explanations and definitions for each KPI, so stakeholders and team members understand what each metric represents and how it’s calculated.
- Update Regularly: Keep the dashboard up to date by regularly entering actual numbers and targets. This will ensure that the dashboard remains relevant and accurate.
Frequently Asked Questions (FAQs)
Click to buy Procurement KPI Dashboard in Google Sheets
What is a Procurement KPI Dashboard?
A Procurement KPI Dashboard is a tool that tracks and measures the key performance indicators related to the procurement process, helping businesses evaluate their procurement efficiency.
How can I create a Procurement KPI Dashboard in Google Sheets?
To create a Procurement KPI Dashboard in Google Sheets, you can use a pre-made template or design one from scratch by including essential KPIs, defining their formulas, and visualizing them with charts and tables.
What are some key KPIs to include in a Procurement Dashboard?
Some key KPIs include Supplier Lead Time, Procurement Cost Savings, Purchase Order Accuracy, Supplier Performance Rating, Order Cycle Time, and Supplier Defect Rate.
How can a Procurement KPI Dashboard improve decision-making?
A Procurement KPI Dashboard provides clear, real-time insights into procurement performance, allowing businesses to make data-driven decisions and optimize their processes.
Can I customize a Procurement KPI Dashboard in Google Sheets?
Yes, Google Sheets allows you to fully customize the dashboard, add new KPIs, modify formulas, and adjust visualizations according to your business requirements.
Conclusion
Click to buy Procurement KPI Dashboard in Google Sheets
A Procurement KPI Dashboard in Google Sheets is an invaluable tool for businesses looking to optimize their procurement process. It provides transparency, improves decision-making, and helps track critical KPIs in real-time. By following best practices, integrating additional features, and continuously improving the dashboard, businesses can ensure they are making the most of their procurement performance data.
Visit our YouTube channel to learn step-by-step video tutorials
Youtube.com/@NeotechNavigators
Click to buy Procurement KPI Dashboard in Google Sheets