Managing multiple project milestones can be challenging without proper visibility into progress, budgets, and delays. The Project Milestone Status and Performance Dashboard in Google Sheets is a ready-to-use tool designed to simplify project tracking and performance management.Project Milestone Status and Performance Dashboard in Google Sheets
This dashboard provides a structured, visual representation of milestones across departments, owners, and months, helping project managers monitor progress, identify risks, and make timely decisions.Project Milestone Status and Performance Dashboard in Google Sheets
What Is Project Milestone Status and Performance Dashboard in Google Sheets?
A Project Milestone Status and Performance Dashboard is a management tool that consolidates all project milestones, budget details, and performance indicators into one visual platform.
By using Google Sheets, this dashboard allows real-time collaboration, easy data updates, and automated insights through charts and summary cards — making it perfect for teams that need an accessible yet powerful tracking solution.
Key Features of the Dashboard
Click to Buy Project Milestone Status and Performance Dashboard in Google Sheets
This ready-to-use dashboard includes multiple analysis sections and one data input sheet. Each sheet plays a vital role in tracking milestones and evaluating project success.
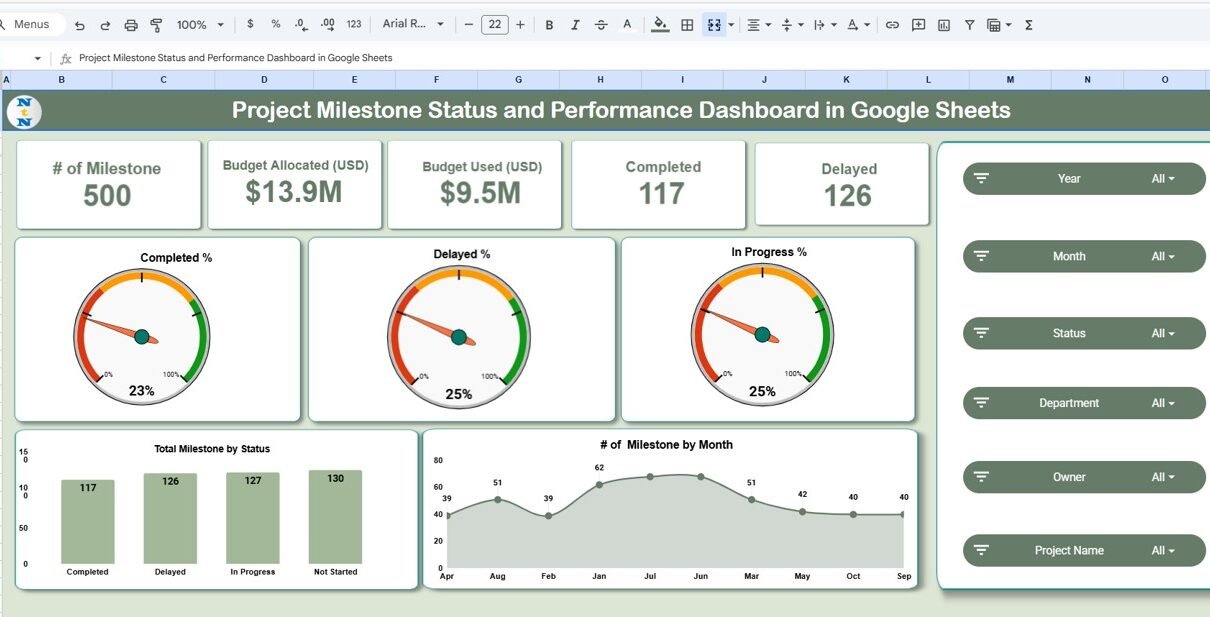
1. Overview Sheet Tab
The Overview sheet provides a summary of key project metrics.
Cards Section:
-
# of Milestones: Total number of milestones across all projects.
-
Budget Allocated (USD): Total budget assigned to all milestones.
-
Budget Used (USD): Actual amount spent so far.
-
Completed: Number of milestones finished successfully.
-
Delayed: Number of milestones running behind schedule.
Charts Section:
-
Completed % / Delayed % / In Progress %: Displays milestone distribution by status.
-
Total Milestones by Status: Bar chart visualizing project progress.
-
# of Milestones by Month: Tracks milestone completion over time.
These visuals help project teams understand progress trends at a glance.

Click to Buy Project Milestone Status and Performance Dashboard in Google Sheets
2. Department Analysis Sheet
The Department Analysis page provides insights into how each department is performing.
Charts Include:
-
Budget Used (USD) by Department – Helps compare financial efficiency.
-
Budget Allocated (USD) by Department – Visualizes resource allocation.
-
Completed Vs In Progress by Department – Monitors milestone completion rates.
This section helps identify departments performing well versus those needing attention.

Click to Buy Project Milestone Status and Performance Dashboard in Google Sheets
3. Project Analysis Sheet
This section focuses on individual project performance.
Charts Include:
-
Budget Used (USD) by Project Name – Shows which projects are consuming more budget.
-
Budget Allocated (USD) by Project Name – Tracks planned financial distribution.
-
Completed Vs In Progress by Project Name – Monitors progress status for each project.
Project managers can use this view to assess whether budget usage aligns with project timelines and goals.Project Milestone Status and Performance Dashboard in Google Sheets

4. Owner Analysis Sheet
The Owner Analysis page evaluates performance by project owner or manager.
Charts Include:
-
Budget Used (USD) by Owner – Shows each owner’s project expenditure.
-
Budget Allocated (USD) by Owner – Visualizes financial accountability.
-
Completed Vs In Progress by Owner – Highlights who is delivering milestones efficiently.
This analysis encourages accountability and supports workload balancing among managers.

Click to Buy Project Milestone Status and Performance Dashboard in Google Sheets
5. Monthly Trends Sheet
The Monthly Trends tab helps track performance and spending over time.
Charts Include:
-
Budget Used (USD) by Month – Reveals monthly expenditure patterns.
-
Budget Allocated (USD) by Month – Compares allocated and used budgets over months.
-
Completed Vs In Progress by Month – Displays how milestone completion changes over time.
This time-based insight helps identify seasonal or process-related delays.

6. Search Function
A built-in Search feature allows users to find specific information quickly.
You can search by Keyword and Field Name to locate particular milestones, projects, or departments.

Click to Buy Project Milestone Status and Performance Dashboard in Google Sheets
7. Data Sheet Tab
The Data Sheet serves as the foundation of this dashboard.
It includes columns for:
-
Milestone ID
-
Project Name
-
Department
-
Owner
-
Budget Allocated / Used (USD)
-
Status (Completed, Delayed, In Progress)
-
Month / Year
Updating this data automatically refreshes all charts and metrics across the dashboard.

Click to Buy Project Milestone Status and Performance Dashboard in Google Sheets
Advantages of Using This Dashboard
✅ Real-Time Collaboration: Teams can view and update milestone progress together in Google Sheets.
✅ Data-Driven Insights: Identify delays, budget overruns, or performance bottlenecks instantly.
✅ Customizable Metrics: Add or modify KPIs based on project needs.
✅ Time Efficiency: Automatically generated visuals save hours of manual reporting.
✅ Improved Accountability: Assign owners to milestones for clear responsibility tracking.Project Milestone Status and Performance Dashboard in Google Sheets
Best Practices for Using the Dashboard
-
Update Data Regularly: Keep the Data Sheet current to ensure accurate reporting.
-
Set Clear Milestone Definitions: Define what qualifies as completed, delayed, or in progress.
-
Monitor Budget Utilization: Compare allocated vs. used budgets to detect inefficiencies.
-
Analyze Monthly Trends: Identify recurring issues or peak workload months.
-
Use Search for Quick Access: Quickly locate specific milestones or departments.
-
Review Owner Performance: Encourage timely delivery and accountability.
How This Dashboard Helps Project Teams
Click to Buy Project Milestone Status and Performance Dashboard in Google Sheets
-
Provides Transparency: Everyone can see up-to-date project performance.
-
Tracks Timelines: Helps ensure milestones are delivered on time.
-
Controls Costs: Monitors budget allocation and usage efficiently.
-
Supports Decision-Making: Data visuals guide strategic project adjustments.
-
Boosts Accountability: Clearly defines responsibility for every milestone.
Frequently Asked Questions (FAQs)
Q1: Can I use this dashboard for multiple projects?
Yes. You can track multiple projects simultaneously by entering each project’s milestones in the Data Sheet.
Q2: How often should I update the data?
It’s best to update data weekly or bi-weekly for accurate tracking and decision-making.
Q3: Can I customize the dashboard for additional KPIs?
Absolutely. You can add more KPIs, charts, or cards based on your organization’s needs.
Q4: Does it work on mobile devices?
Yes, since it’s built in Google Sheets, you can access it anytime, anywhere, on any device.
Q5: How can I analyze project delays?
Use the Delayed % chart and departmental comparisons to identify areas with recurring issues.
Conclusion
Click to Buy Project Milestone Status and Performance Dashboard in Google Sheets
The Project Milestone Status and Performance Dashboard in Google Sheets is a powerful tool for managing complex projects. It provides complete visibility into milestone progress, budgets, and performance trends—helping teams deliver results efficiently.Project Milestone Status and Performance Dashboard in Google Sheets
Visit our YouTube channel to learn step-by-step video tutorials
Youtube.com/@NeotechNavigators
Watch the step-by-step video Demo:
Click to Buy Project Milestone Status and Performance Dashboard in Google Sheets