Managing multiple projects can get overwhelming without a structured way to monitor milestones, budgets, and timelines. The Project Milestone Tracking Dashboard in Google Sheets offers a ready-to-use solution for tracking progress, identifying delays, and visualizing performance trends — all in one interactive dashboard.Project Milestone Tracking Dashboard in Google Sheets
In this article, we’ll explore the dashboard’s structure, features, advantages, best practices, and how it can streamline project management for your team.Project Milestone Tracking Dashboard in Google Sheets
What Is a Project Milestone Tracking Dashboard in Google Sheets?
A Project Milestone Tracking Dashboard is a performance management tool built in Google Sheets that helps project managers monitor milestone completion, analyze department-level progress, and manage budgets effectively.
This dashboard displays visual analytics for:
-
Budget allocation and utilization
-
Milestone completion percentages
-
Department and owner-level performance
-
Monthly project trends
With built-in charts and filters, it’s ideal for organizations managing multiple ongoing projects simultaneously.
Key Features of the Project Milestone Tracking Dashboard
Click to Buy Project Milestone Tracking Dashboard in Google Sheets
This Google Sheets dashboard includes multiple pages designed for structured analysis and easy navigation:
Overview Sheet Tab
The Overview Sheet offers a snapshot of project health using key performance cards and charts.
Cards Section:
-
# of Milestones: Total milestones created across all projects
-
Budget Allocated (USD): Total budget assigned to projects
-
Budget Used (USD): Actual expenditure
-
Completed: Number of completed milestones
-
Delayed: Milestones running behind schedule
Charts Section:
-
Total Milestone by Status – Visual breakdown of completed, in-progress, and delayed milestones
-
Completed % / In Progress % / Delayed % – Overall project completion status at a glance
This page gives a clear, real-time picture of project health.
Click to Buy Project Milestone Tracking Dashboard in Google Sheets
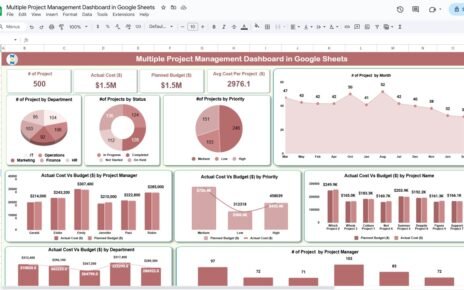
Project Analysis Tab
Analyze financial performance and progress for each project.
Charts include:
-
Budget Used (USD) by Project Name
-
Budget Allocated (USD) by Project Name
-
Completed vs. In Progress by Project Name
This allows managers to identify projects exceeding budgets or facing delays.
Click to Buy Project Milestone Tracking Dashboard in Google Sheets
Department Analysis Tab
Measure performance at the department level.
Charts include:
-
Budget Used (USD) by Department
-
Budget Allocated (USD) by Department
-
Completed vs. In Progress by Department
Department heads can track how efficiently their teams are managing milestones and staying within budget.
Click to Buy Project Milestone Tracking Dashboard in Google Sheets
Owner Analysis Tab
Evaluate the accountability of project owners or managers.
Charts include:
-
Budget Used (USD) by Owner
-
Budget Allocated (USD) by Owner
-
Completed vs. In Progress by Owner
This section highlights which owners are performing best and which need attention.
Monthly Trends Tab
Analyze project progress month by month to identify seasonal or workflow trends.
Charts include:
-
Budget Used (USD) by Month
-
Budget Allocated (USD) by Month
-
Completed vs. In Progress by Month
Trend analysis helps in forecasting, resource planning, and identifying recurring bottlenecks.
Click to Buy Project Milestone Tracking Dashboard in Google Sheets
Search Tab
This tab allows users to search by keyword or field name for quick access to specific milestones, projects, or departments. It makes the dashboard dynamic and user-friendly for large data sets.
Data Sheet Tab
The Data Sheet serves as the backend where users enter raw data for all projects and milestones.
Fields typically include:
-
Project Name
-
Department
-
Owner
-
Budget Allocated
-
Budget Used
-
Milestone Status
-
Completion Date
Once data is entered, the entire dashboard updates automatically.
Click to Buy Project Milestone Tracking Dashboard in Google Sheets
Advantages of Using the Project Milestone Tracking Dashboard
✅ Centralized Tracking: Monitor all project milestones and progress in one place
✅ Budget Monitoring: Compare allocated vs. used funds in real time
✅ Visual Insights: Easy-to-read charts highlight project performance
✅ Accountability: Track progress by department and project owner
✅ Trend Analysis: Identify performance patterns month-over-month
✅ Customizable: Add more KPIs or filters as per business needs
Best Practices for Using the Dashboard
-
Update data regularly to maintain real-time insights.
-
Define clear milestone criteria before tracking to ensure accuracy.
-
Review department-level reports weekly to avoid project bottlenecks.
-
Use color coding (green for on track, yellow for in progress, red for delayed).
-
Leverage monthly trends to optimize planning for future projects.
How This Dashboard Helps Project Managers
Click to Buy Project Milestone Tracking Dashboard in Google Sheets
-
Simplifies milestone progress tracking across departments
-
Increases visibility into budgets and expenditures
-
Encourages accountability for project owners
-
Improves forecasting and decision-making
-
Saves hours of manual reporting time
Frequently Asked Questions (FAQs)
Q1: Can I add new departments or project owners?
Yes, you can easily modify dropdown lists in the data sheet to include new departments or owners.
Q2: Does the dashboard auto-update when I add new data?
Yes, once you input data in the Data Sheet, the visuals refresh automatically.
Q3: Can I use this dashboard for multiple years?
Yes, you can extend the monthly trends section to include multiple years of data.
Q4: Is this template beginner-friendly?
Absolutely. It’s designed for users with basic Google Sheets knowledge.
Q5: Can I share this dashboard with my team?
Yes, Google Sheets allows real-time collaboration and team access.
Conclusion
Click to Buy Project Milestone Tracking Dashboard in Google Sheets
The Project Milestone Tracking Dashboard in Google Sheets is a comprehensive tool that helps managers monitor progress, track budgets, and ensure project milestones stay on schedule. With interactive charts, MTD/YTD comparisons, and trend analysis, this dashboard empowers data-driven project management — without the need for complex software.
Visit our YouTube channel to learn step-by-step video tutorials
Youtube.com/@NeotechNavigators
Click to Buy Project Milestone Tracking Dashboard in Google Sheets